Worst Places To Spend Your Golden Years and Where To Retire Instead

Once you retire, money takes on a brand new meaning. You become keenly attuned to every dollar of your nest egg, balancing things you may have once taken for granted while working, such as traveling, making big purchases and general expenditures.
Read More: Retirement 2024: These Are the 10 Worst Places To Retire in North Carolina
Check Out: How To Get $340 Per Year in Cash Back on Gas and Other Things You Already Buy
For those of you with plans to relocate in retirement, your biggest concern might be finding an affordable and desirable place.
That’s why GOBankingRates identified one location in every state that will eat away your savings fast and one place that can provide you a welcome respite from unbearable bills.
See which community in your state you should avoid when you’re getting ready to hang it up, and which one might help you live a richer and more fulfilling retirement.

Alabama
Worst place to retire: Opelika
Percentage of population over 65: 18.4
Average home value: $242,175
Annual expenditures: $46,197
Livability score: 62
Where to retire instead: Decatur
Percentage of population over 65: 19
Average home value: $182,368
Annual expenditures: $41,921
Livability score: 74
Check Out: Retirement Planning: Here’s How Much Money You Actually Need To Age in Place
Read More: Owe Money to the IRS? Most People Don’t Realize They Should Do This One Thing

Arizona
Worst place to retire: Scottsdale
Percentage of population over 65: 24.6
Average home value: $866,169
Annual expenditures: $74,145
Livability score: 69
Where to retire instead: Surprise
Percentage of population over 65: 22.8
Average home value: $423,060
Annual expenditures: $56,104
Livability score: 84
Explore More: 7 Bills You Never Have To Pay When You Retire
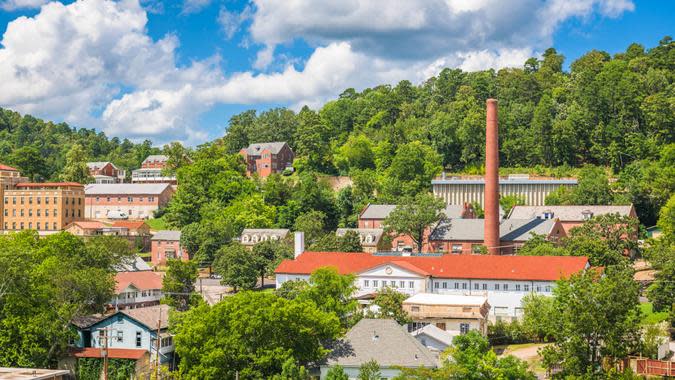
Arkansas
Worst place to retire: Hot Springs
Percentage of population over 65: 21.4
Average home value: $218,538
Annual expenditures: $43,016
Livability score: 62
Where to retire instead: Hot Springs Village
Percentage of population over 65: 63.3
Average home value: $279,670
Annual expenditures: $46,979
Livability score: 73

California
Worst place to retire: Beverly Hills
Percentage of population over 65: 22.9
Average home value: $5,456,590
Annual expenditures: $251,424
Livability score: 78
Where to retire instead: Seal Beach
Percentage of population over 65: 41.6
Average home value: $1,403,313
Annual expenditures: $96,357
Livability score: 77

Colorado
Worst place to retire: Lakewood
Percentage of population over 65: 16.8
Average home value: $587,420
Annual expenditures: $67,731
Livability score: 66
Where to retire instead: Loveland
Percentage of population over 65: 20.4
Average home value: $496,551
Annual expenditures: $58,711
Livability score: 83

Connecticut
Worst place to retire: Norwich
Percentage of population over 65: 17.1
Average home value: $230,920
Annual expenditures: $49,743
Livability score: 68
Where to retire instead: Newington
Percentage of population over 65: 20.9
Average home value: $296,929
Annual expenditures: $55,322
Livability score: 83
Find Out: Tony Robbins: 5 Retirement Planning Tips He Swears By
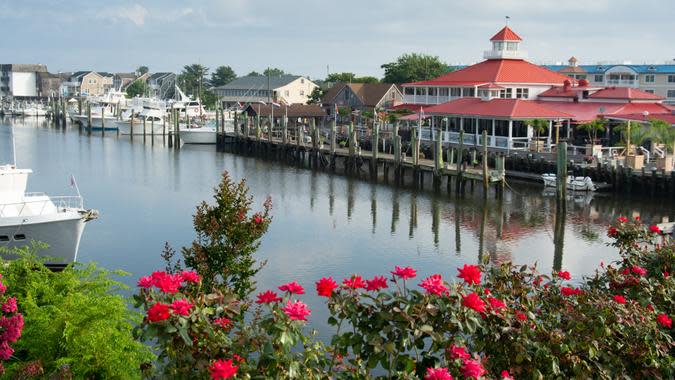
Delaware
Worst place to retire: Hockessin
Percentage of population over 65: 22.2
Average home value: $543,015
Annual expenditures: $65,176
Livability score: 83
Where to retire instead: Milford
Percentage of population over 65: 25.8
Average home value: $307,733
Annual expenditures: $49,534
Livability score: 61
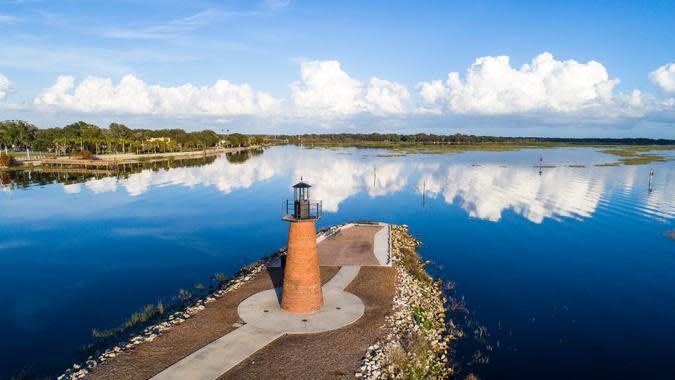
Florida
Worst place to retire: Miami Beach
Percentage of population over 65: 17.1
Average home value: $2,256,246
Annual expenditures: $61,161
Livability score: 69
Where to retire instead: The Villages
Percentage of population over 65: 85.7
Average home value: $419,947
Annual expenditures: $51,463
Livability score: 79

Georgia
Worst place to retire: Thomasville
Percentage of population over 65: 17.2
Average home value: $182,734
Annual expenditures: $40,826
Livability score: 64
Where to retire instead: Peachtree City
Percentage of population over 65: 18.6
Average home value: $481,231
Annual expenditures: $60,379
Livability score: 90
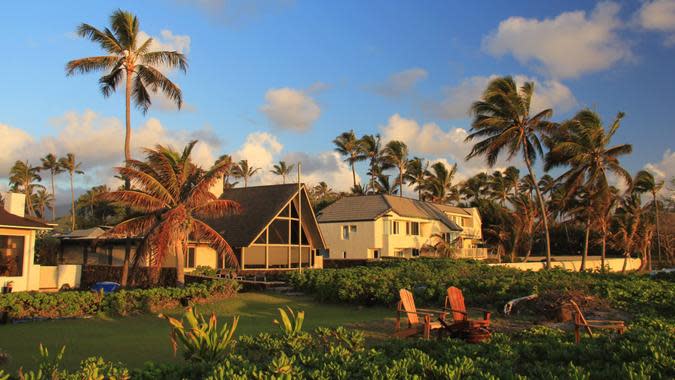
Hawaii
Worst place to retire: Kahului
Percentage of population over 65: 17.9
Average home value: $934,860
Annual expenditures: $81,809
Livability score: 64
Where to retire instead: Mililani
Percentage of population over 65: 24.8
Average home value: $1,030,044
Annual expenditures: $94,010
Livability score: 73
Check Out: Here’s the Average Amount Retiree Households Spend in a Year

Idaho
Worst place to retire: Coeur d’Alene
Percentage of population over 65: 18.5
Average home value: $540,423
Annual expenditures: $59,493
Livability score: 76
Where to retire instead: Eagle
Percentage of population over 65: 21.9
Average home value: $789,340
Annual expenditures: $78,212
Livability score: 86

Illinois
Worst place to retire: Wilmette
Percentage of population over 65: 19.9
Average home value: $761,015
Annual expenditures: $81,288
Livability score: 81
Where to retire instead: Huntley
Percentage of population over 65: 33.6
Average home value: $345,817
Annual expenditures: $56,834
Livability score: 83

Indiana
Worst place to retire: Granger
Percentage of population over 65: 16.9
Average home value: $352,324
Annual expenditures: $50,472
Livability score: 85
Where to retire instead: Kokomo
Percentage of population over 65: 18.6
Average home value: $138,200
Annual expenditures: $39,158
Livability score: 63
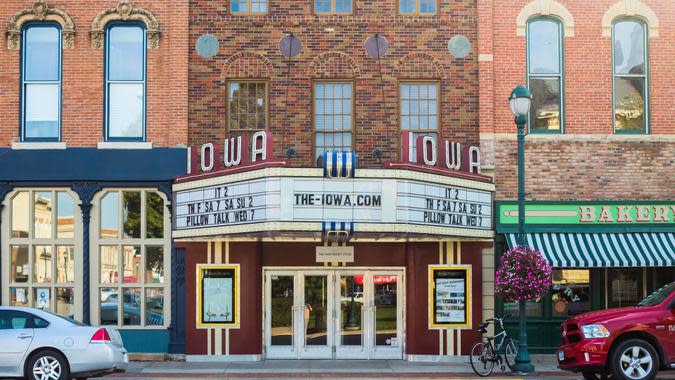
Iowa
Worst place to retire: Marshalltown
Percentage of population over 65: 17.4
Average home value: $133,143
Annual expenditures: $38,011
Livability score: 68
Where to retire instead: Dubuque
Percentage of population over 65: 18.9
Average home value: $207,159
Annual expenditures: $42,756
Livability score: 79
Read Next: 10 Things Boomers Should Always Buy in Retirement

Kansas
Worst place to retire: Salina
Percentage of population over 65: 17.2
Average home value: $163,024
Annual expenditures: $38,845
Livability score: 70
Where to retire instead: Hutchinson
Percentage of population over 65: 17.9
Average home value: $121,345
Annual expenditures: $37,542
Livability score: 70

Kentucky
Worst place to retire: Florence
Percentage of population over 65: 17.3
Average home value: $269,785
Annual expenditures: $48,230
Livability score: 69
Where to retire instead: Owensboro
Percentage of population over 65: 18.5
Average home value: $182,968
Annual expenditures: $41,817
Livability score: 73

Louisiana
Worst place to retire: Marrero
Percentage of population over 65: 18.9
Average home value: $165,986
Annual expenditures: $48,595
Livability score: 65
Where to retire instead: Metairie
Percentage of population over 65: 20.9
Average home value: $276,330
Annual expenditures: $53,966
Livability score: 82

Maine
Worst place to retire: Bangor
Percentage of population over 65: 17.1
Average home value: $233,290
Annual expenditures: $43,798
Livability score: 72
Where to retire instead: Lewiston
Percentage of population over 65: 17.9
Average home value: $247,453
Annual expenditures: $44,893
Livability score: 70
Read More: Why Florida’s Retirees Are Fleeing — And Where They’re Going Instead

Maryland
Worst place to retire: Annapolis
Percentage of population over 65: 17.3
Average home value: $558,850
Annual expenditures: $63,716
Livability score: 60
Where to retire instead: Carney
Percentage of population over 65: 22.7
Average home value: $299,552
Annual expenditures: $53,236
Livability score: 70

Massachusetts
Worst place to retire: Reading
Percentage of population over 65: 18.7
Average home value: $780,665
Annual expenditures: $79,880
Livability score: 52
Where to retire instead: Peabody
Percentage of population over 65: 22.9
Average home value: $611,081
Annual expenditures: $68,253
Livability score: 72

Michigan
Worst place to retire: Oak Park
Percentage of population over 65: 17
Average home value: $202,422
Annual expenditures: $50,785
Livability score: 74
Where to retire instead: Livonia
Percentage of population over 65: 21.2
Average home value: $267,383
Annual expenditures: $51,411
Livability score: 89
Minnesota
Worst place to retire: Winona
Percentage of population over 65: 16.9
Average home value: $205,672
Annual expenditures: $40,566
Livability score: 73
Where to retire instead: Minnetonka
Percentage of population over 65: 20.8
Average home value: $463,573
Annual expenditures: $59,754
Livability score: 86
Check Out: Social Security 2024: 6 Changes That Impact Your Benefits

Mississippi
Worst place to retire: Brandon
Percentage of population over 65: 17.7
Average home value: $258,994
Annual expenditures: $46,875
Livability score: 86
Where to retire instead: Meridian
Percentage of population over 65: 16.8
Average home value: $97,464
Annual expenditures: $37,385
Livability score: 85
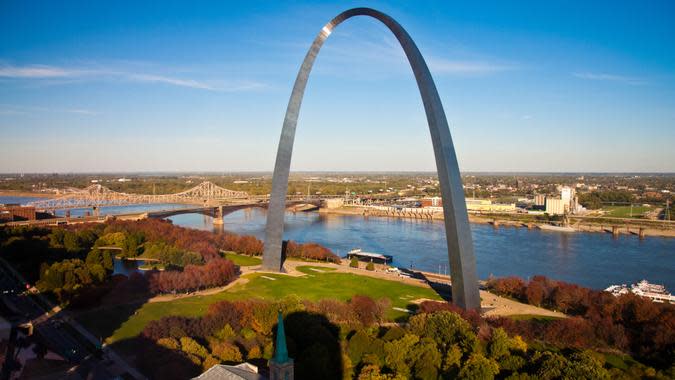
Missouri
Worst place to retire: Wildwood
Percentage of population over 65: 18.1
Average home value: $496,204
Annual expenditures: $61,944
Livability score: 77
Where to retire instead: Independence
Percentage of population over 65: 17.9
Average home value: $178,312
Annual expenditures: $44,581
Livability score: 71

Montana
Worst place to retire: Billings
Percentage of population over 65: 17.4
Average home value: $361,273
Annual expenditures: $48,700
Livability score: 61
Where to retire instead: Great Falls
Percentage of population over 65: 19.3
Average home value: $278,511
Annual expenditures: $45,571
Livability score: 64

Nebraska
Worst place to retire: Columbus
Percentage of population over 65: 16.8
Average home value: $231,646
Annual expenditures: $42,860
Livability score: 85
Where to retire instead: Hastings
Percentage of population over 65: 17.4
Average home value: $165,631
Annual expenditures: $40,618
Livability score: 85
Read Next: 44 Best Small Towns To Retire in America

Nevada
Worst place to retire: Carson City
Percentage of population over 65: 20.2
Average home value: $444,790
Annual expenditures: $57,720
Livability score: 71
Where to retire instead: Pahrump
Percentage of population over 65: 31.6
Average home value: $332,878
Annual expenditures: $50,003
Livability score: 62

New Hampshire
Worst place to retire: Rochester
Percentage of population over 65: 17.4
Average home value: $336,202
Annual expenditures: $49,847
Livability score: 73
Where to retire instead: Concord
Percentage of population over 65: 17.3
Average home value: $381,643
Annual expenditures: $49,951
Livability score: 82

New Jersey
Worst place to retire: Long Branch
Percentage of population over 65: 17
Average home value: $596,124
Annual expenditures: $66,480
Livability score: 63
Where to retire instead: Toms River
Percentage of population over 65: 18.9
Average home value: $382,023
Annual expenditures: $54,227
Livability score: 74

New Mexico
Worst place to retire: Los Lunas
Percentage of population over 65: 17.9
Average home value: $262,900
Annual expenditures: $45,050
Livability score: 60
Where to retire instead: Alamogordo
Percentage of population over 65: 18.8
Average home value: $192,017
Annual expenditures: $38,532
Livability score: 72
Explore More: 8 Ways Middle-Class People Become Poor in Retirement
New York
Worst place to retire: Mount Vernon
Percentage of population over 65: 17.7
Average home value: $524,676
Annual expenditures: $73,310
Livability score: 55
Where to retire instead: North Tonawanda
Percentage of population over 65: 18.7
Average home value: $222,841
Annual expenditures: $46,458
Livability score: 87

North Carolina
Worst place to retire: Salisbury
Percentage of population over 65: 16.9
Average home value: $230,430
Annual expenditures: $44,424
Livability score: 58
Where to retire instead: New Bern
Percentage of population over 65: 23.2
Average home value: $237,971
Annual expenditures: $43,277
Livability score: 62

North Dakota
Worst place to retire: Wahpeton
Percentage of population over 65: 17
Average home value: $194,452
Annual expenditures: $41,191
Livability score: 68
Where to retire instead: Valley City
Percentage of population over 65: 20.4
Average home value: $154,997
Annual expenditures: $41,244
Livability score: 85

Ohio
Worst place to retire: Lancaster
Percentage of population over 65: 17.8
Average home value: $219,328
Annual expenditures: $45,832
Livability score: 63
Where to retire instead: Parma
Percentage of population over 65: 19.5
Average home value: $171,111
Annual expenditures: $42,547
Livability score: 86
Read Next: 6 Ways To Lower Expenses in Retirement While Still Living a Luxury Lifestyle

Oklahoma
Worst place to retire: Yukon
Percentage of population over 65: 17.3
Average home value: $246,950
Annual expenditures: $46,823
Livability score: 80
Where to retire instead: Bartlesville
Percentage of population over 65: 18.6
Average home value: $156,134
Annual expenditures: $40,983
Livability score: 73

Oregon
Worst place to retire: Woodburn
Percentage of population over 65: 17.9
Average home value: $389,410
Annual expenditures: $54,227
Livability score: 64
Where to retire instead: Lake Oswego
Percentage of population over 65: 21
Average home value: $920,834
Annual expenditures: $82,591
Livability score: 84

Pennsylvania
Worst place to retire: Bethlehem
Percentage of population over 65: 17.9
Average home value: $293,679
Annual expenditures: $49,951
Livability score: 70
Where to retire instead: Bethel Park
Percentage of population over 65: 23.9
Average home value: $267,960
Annual expenditures: $51,255
Livability score: 94
Rhode Island
Worst place to retire: Newport
Percentage of population over 65: 19.1
Average home value: $827,327
Annual expenditures: $73,884
Livability score: 69
Where to retire instead: Warwick
Percentage of population over 65: 20.5
Average home value: $340,800
Annual expenditures: $54,018
Livability score: 75
Find Out: 8 States To Move to If You Don’t Want To Pay Taxes on Social Security

South Carolina
Worst place to retire: Myrtle Beach
Percentage of population over 65: 21.3
Average home value: $353,361
Annual expenditures: $45,571
Livability score: 62
Where to retire instead: Mount Pleasant
Percentage of population over 65: 17.5
Average home value: $746,046
Annual expenditures: $67,105
Livability score: 86

South Dakota
Worst place to retire: Rapid City
Percentage of population over 65: 19
Average home value: $305,252
Annual expenditures: $49,847
Livability score: 65
Where to retire instead: Mitchell
Percentage of population over 65: 20.3
Average home value: $210,720
Annual expenditures: $41,609
Livability score: 76

Tennessee
Worst place to retire: Oak Ridge
Percentage of population over 65: 17.8
Average home value: $248,538
Annual expenditures: $44,320
Livability score: 71
Where to retire instead: Kingsport
Percentage of population over 65: 24.7
Average home value: $194,984
Annual expenditures: $41,452
Livability score: 67

Texas
Worst place to retire: Colleyville
Percentage of population over 65: 17.8
Average home value: $825,890
Annual expenditures: $76,491
Livability score: 89
Where to retire instead: Georgetown
Percentage of population over 65: 28.8
Average home value: $467,470
Annual expenditures: $61,057
Livability score: 81
Discover More: 16 Best Places To Retire in the US That Feel Like Europe

Utah
Worst place to retire: Holladay
Percentage of population over 65: 18.5
Average home value: $780,515
Annual expenditures: $73,154
Livability score: 75
Where to retire instead: Saint George
Percentage of population over 65: 22.7
Average home value: $507,391
Annual expenditures: $56,208
Livability score: 76

Virginia
Worst place to retire: Petersburg
Percentage of population over 65: 16.8
Average home value: $248,762
Annual expenditures: $41,817
Livability score: 59
Where to retire instead: Danville
Percentage of population over 65: 20.3
Average home value: $114,669
Annual expenditures: $35,977
Livability score: 74

Washington
Worst place to retire: Des Moines
Percentage of population over 65: 17.5
Average home value: $580,113
Annual expenditures: $68,826
Livability score: 70
Where to retire instead: Mercer Island
Percentage of population over 65: 19.8
Average home value: $2,192,061
Annual expenditures: $51,359
Livability score: 85
West Virginia
Worst place to retire: Huntington
Percentage of population over 65: 17.2
Average home value: $105,639
Annual expenditures: $39,314
Livability score: 60
Where to retire instead: Wheeling
Percentage of population over 65: 24
Average home value: $125,064
Annual expenditures: $39,627
Livability score: 71
Find Out: Suze Orman: 5 Social Security Facts Every Soon-To-Be Retiree Must Know

Wisconsin
Worst place to retire: Caledonia
Percentage of population over 65: 18.2
Average home value: $292,132
Annual expenditures: $50,212
Livability score: 73
Where to retire instead: Mount Pleasant
Percentage of population over 65: 22.8
Average home value: $288,462
Annual expenditures: $46,562
Livability score: 85

Wyoming
Worst place to retire: Lander
Percentage of population over 65: 18.6
Average home value: $346,255
Annual expenditures: $50,316
Livability score: 72
Where to retire instead: Sheridan
Percentage of population over 65: 19.6
Average home value: $388,063
Annual expenditures: $50,785
Livability score: 83
Jordan Rosenfeld and Jake Arky contributed to the reporting for this article.
In order to find the worst places to spend your golden years and where to retire instead, GOBankingRates first found every city in each state that had both a population over 25,000 and a population of people 65 years and older over 16.8% (the national average) of the total population as sourced from the 2021 American Community Survey conducted by the US Census Bureau. Once these cities were identified for each state, GOBankingRates scored them across the following factors: (1) population over 65 as sourced from the 2021 American Community Survey; (2) percent of total population 65 years and older as sourced from the 2021 American Community Survey; (3) the 2023 average single family residence Zillow home value index as sourced from Zillow’s housing data through February 2023; (4) annual expenditures for a person 65 and older using the Bureau of Labor Statistic’s 2021 consumer expenditure survey, which was then factored out for each city using a cost of living index sourced from Sperling’s Best Places; and (5) a livability score out of 100 as sourced from AreaVibes. All factors were then scored and combined, with the lowest score being best. Once all scores were tabulated, the qualifying city with the highest overall score was deemed that state’s “worst place to spend your golden years” and the city with the lowest score was deemed “where to retire to instead”. For some states, the population requirement was lowered to have a better representation of desirable cities (20,000 for MS, NE, NH and OK; 15,000 for AR, GA, NM; 10,000 for DE; and 5,000 for ND and WY). Alaska and Vermont did not have enough cities to be included in the final list. All data was collected and is up to date as of April 17, 2023.
Photo Disclaimer: Please note photos are for representational purposes only. As a result, some of the photos might not reflect the locations listed in this article.
More From GOBankingRates
I'm a Bank Teller: 9 Reasons You Should Never Ask for $2 Bills From the Bank
5 Reasons You Should Consider an Annuity For Your Retirement Savings
This article originally appeared on GOBankingRates.com: Worst Places To Spend Your Golden Years and Where To Retire Instead
