Wealth in America: 50 Cities Where the Upper Class Is Growing the Most
As the cost of living continues to increase, many Americans are prioritizing increasing their income to keep up with expenses.
Recent data from GOBankingRates outlined the 50 U.S. cities where the upper class is growing the fastest. To determine which cities rank for highest to lowest income growth, GOBankingRates pulled two data points from the original study: the three-year percent change in mean household income between 2019 to 2022 and the three-year percent change in population with a $200K income.
See which 50 cities rank in order from the highest to lowest income growth percent change.
Read More: How Can You Withdraw Money From a Bank Account? 3 Ways To Know
Try This: 7 Unusual Ways To Make Extra Money (That Actually Work)
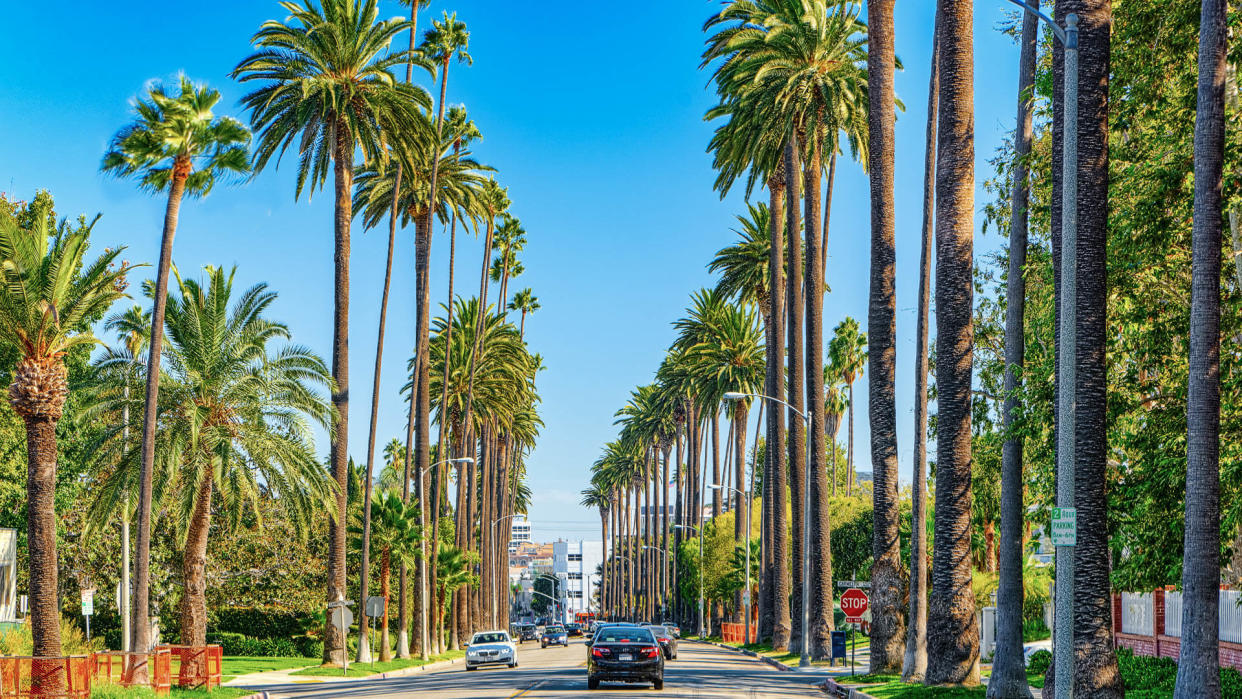
Pleasanton, California
3-year percent change in mean household income (2019-2022): 19.95%
3-year percent change in population with income of $200K+: 24.03%
Be Aware: Check Your $2 Bills — They Could Be Worth a Ton
Learn More: I’m a Bank Teller: 3 Times You Should Never Ask For $100 Bills at the Bank
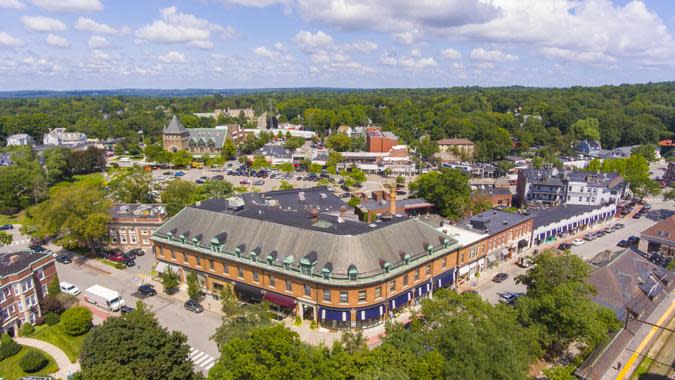
Severna Park, Maryland
3-year percent change in mean household income (2019-2022): 13.54%
3-year percent change in population with income of $200K+: 23.84%
View Next: 7 Things To Know If You Withdraw More Than $10,000 From Your Checking Account

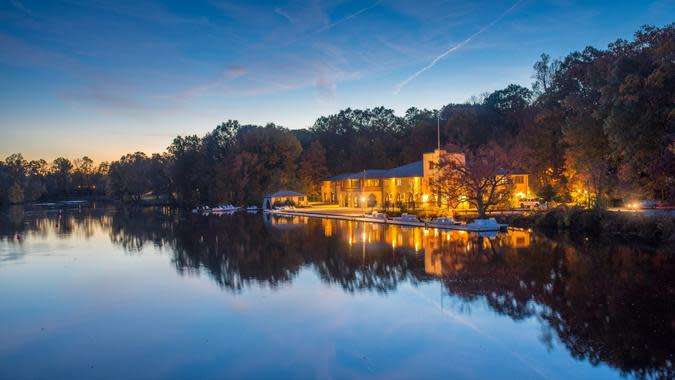
Wellesley, Massachusetts
3-year percent change in mean household income (2019-2022): 27.80%
3-year percent change in population with income of $200K+: 23.12%

Mercer Island, Washington
3-year percent change in mean household income (2019-2022): 29.40%
3-year percent change in population with income of $200K+: 22.90%
Check Out: Warren Buffett’s Parenting Rule: The Key to Raising Money-Savvy Kids
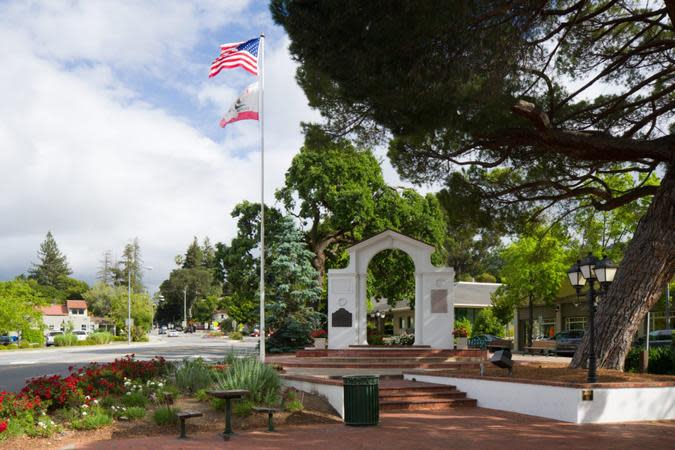
Los Gatos, California
3-year percent change in mean household income (2019-2022): 40.23%
3-year percent change in population with income of $200K+: 22.83%
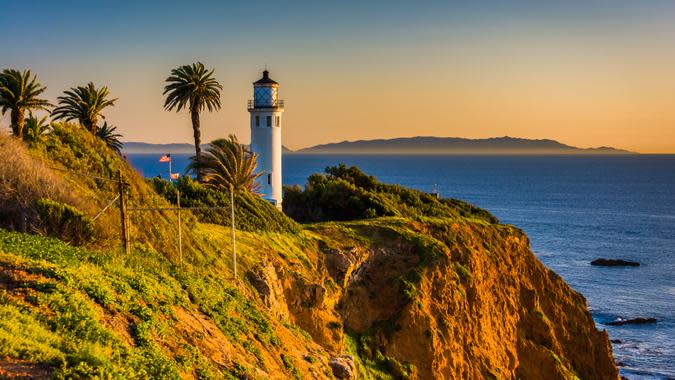
Rancho Palos Verdes, California
3-year percent change in mean household income (2019-2022): 20.43%
3-year percent change in population with income of $200K+: 22.66%
Trending Now: Suze Orman: 3 Ways To Prepare for the Upcoming Financial Pandemic
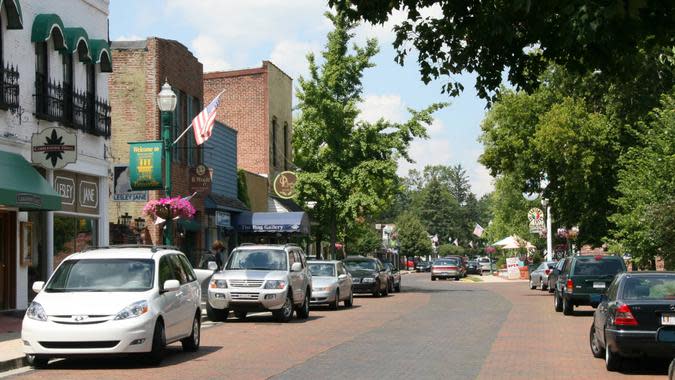
Zionsville, Indiana
3-year percent change in mean household income (2019-2022): 10.83%
3-year percent change in population with income of $200K+: 22.60%

San Ramon, California
3-year percent change in mean household income (2019-2022): 19.97%
3-year percent change in population with income of $200K+: 22.19%
Discover More: 8 Rare Coins Worth Millions That Are Highly Coveted by Coin Collectors
Saratoga, California
3-year percent change in mean household income (2019-2022): 27.85%
3-year percent change in population with income of $200K+: 21.97%
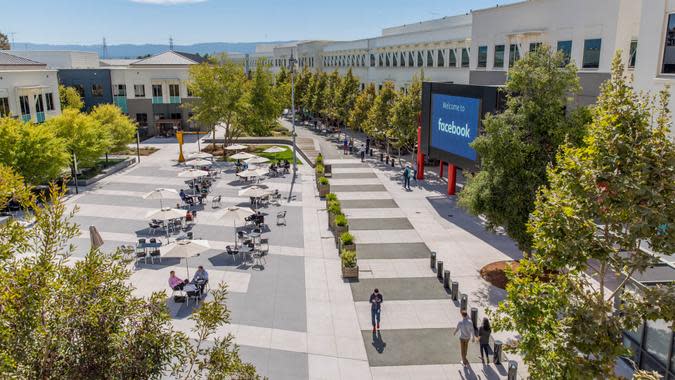
Menlo Park, California
3-year percent change in mean household income (2019-2022): 31.24%
3-year percent change in population with income of $200K+: 21.78%
See Next: 10 of the Most Valuable Pennies
Dublin, Ohio
3-year percent change in mean household income (2019-2022): 11.39%
3-year percent change in population with income of $200K+: 21.48%
Cottage Lake, Washington
3-year percent change in mean household income (2019-2022): 16.99%
3-year percent change in population with income of $200K+: 21.47%
Try This: Warren Buffett: 6 Best Pieces of Money Advice for the Middle Class
The Woodlands, Texas
3-year percent change in mean household income (2019-2022): 12.74%
3-year percent change in population with income of $200K+: 21.40%
Ladera Ranch, California
3-year percent change in mean household income (2019-2022): 6.82%
3-year percent change in population with income of $200K+: 21.28%
That’s Interesting: 9 Bills Frugal People Don’t Pay
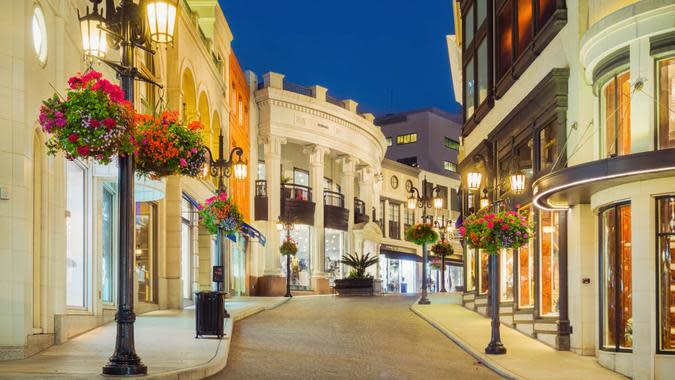
Beverly Hills, California
3-year percent change in mean household income (2019-2022): 18.43%
3-year percent change in population with income of $200K+: 20.91%
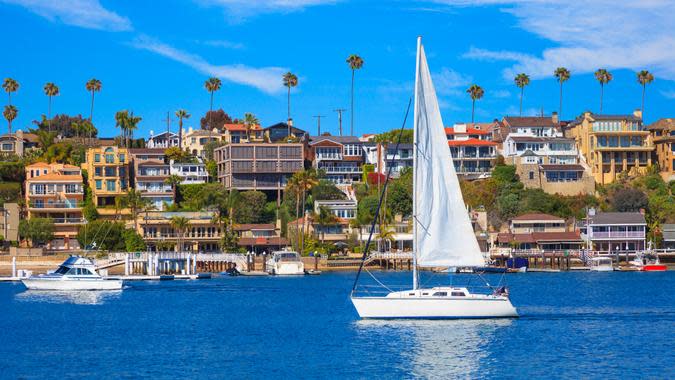
Newport Beach, California
3-year percent change in mean household income (2019-2022): 12.55%
3-year percent change in population with income of $200K+: 20.43%
View More: 8 States To Move to If You Don’t Want To Pay Taxes on Social Security
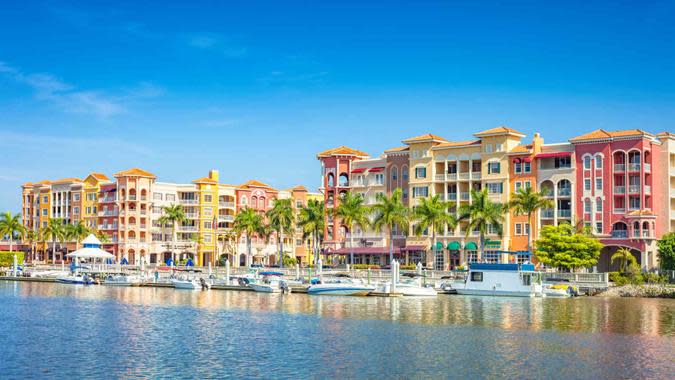
Naples, Florida
3-year percent change in mean household income (2019-2022): 27.56%
3-year percent change in population with income of $200K+: 20.21%
Union Hill-Novelty Hill, Washington
3-year percent change in mean household income (2019-2022): 24.88%
3-year percent change in population with income of $200K+: 19.43%
Explore More: 7 Florida Cities That Could Be Headed for a Housing Crisis

Winchester, Massachusetts
3-year percent change in mean household income (2019-2022): 24.46%
3-year percent change in population with income of $200K+: 19.05%

McLean, Virginia
3-year percent change in mean household income (2019-2022): 22.76%
3-year percent change in population with income of $200K+: 18.62%
Discover Next: 8 Places Where Houses Are Suddenly Major Bargains
Princeton, New Jersey
3-year percent change in mean household income (2019-2022): 14.95%
3-year percent change in population with income of $200K+: 18.59%
Newton, Massachusetts
3-year percent change in mean household income (2019-2022): 21.03%
3-year percent change in population with income of $200K+: 18.40%
Be Aware: 5 Types of Homes That Will Plummet in Value in 2024
Harrison, New York
3-year percent change in mean household income (2019-2022): 11.98%
3-year percent change in population with income of $200K+: 18.18%
Westfield, New Jersey
3-year percent change in mean household income (2019-2022): 19.85%
3-year percent change in population with income of $200K+: 18.14%
For You: The Best Place To Live on a $100,000 Salary in Every State
Garden City, New York
3-year percent change in mean household income (2019-2022): 16.56%
3-year percent change in population with income of $200K+: 17.97%
Hoboken, New Jersey
3-year percent change in mean household income (2019-2022): 14.93%
3-year percent change in population with income of $200K+: 17.58%
Find Out: I’m a Real Estate Agent: These 5 Cities Are Becoming Unaffordable

San Carlos, California
3-year percent change in mean household income (2019-2022): 24.66%
3-year percent change in population with income of $200K+: 16.92%
Manhattan Beach, California
3-year percent change in mean household income (2019-2022): 11.42%
3-year percent change in population with income of $200K+: 16.87%
Read More: Why Florida’s Retirees Are Fleeing — And Where They’re Going Instead
Parkland, Florida
3-year percent change in mean household income (2019-2022): 4.11%
3-year percent change in population with income of $200K+: 16.79%

Lafayette, California
3-year percent change in mean household income (2019-2022): 24.62%
3-year percent change in population with income of $200K+: 16.78%
Trending Now: Barbara Corcoran Says, ‘Forget About Florida,’ Move Here for Cheap Homes

Rockville Centre, New York
3-year percent change in mean household income (2019-2022): 18.36%
3-year percent change in population with income of $200K+: 16.50%
Libertyville, Illinois
3-year percent change in mean household income (2019-2022): 19.76%
3-year percent change in population with income of $200K+: 16.47%
Discover More: In Less Than a Decade, You Won’t Be Able To Afford Homes in These ZIP Codes
Millbrae, California
3-year percent change in mean household income (2019-2022): 22.26%
3-year percent change in population with income of $200K+: 16.33%

North Tustin, California
3-year percent change in mean household income (2019-2022): 18.39%
3-year percent change in population with income of $200K+: 15.68%
Be Aware: How Much Monthly Income Could You Get From a $200,000 Annuity?

Brentwood, Tennessee
3-year percent change in mean household income (2019-2022): 14.68%
3-year percent change in population with income of $200K+: 15.21%
Wilmette, Illinois
3-year percent change in mean household income (2019-2022): 12.39%
3-year percent change in population with income of $200K+: 15.06%
Explore Next: Cutting Expenses in Retirement: 5 Grocery and Dining Costs To Eliminate

Summit, New Jersey
3-year percent change in mean household income (2019-2022): 14.25%
3-year percent change in population with income of $200K+: 14.29%
Hermosa Beach, California
3-year percent change in mean household income (2019-2022): 12.10%
3-year percent change in population with income of $200K+: 13.51%
See Next: 4 Genius Things People Do With Their Retirement Accounts After Retiring (And 4 Things To Avoid)
Lexington, Massachusetts
3-year percent change in mean household income (2019-2022): 21.30%
3-year percent change in population with income of $200K+: 12.20%

Leawood, Kansas
3-year percent change in mean household income (2019-2022): 3.18%
3-year percent change in population with income of $200K+: 11.75%
For You: 6 Money Moves To Make When Your 401(k) Hits $1 Million
Los Altos, California
3-year percent change in mean household income (2019-2022): 22.78%
3-year percent change in population with income of $200K+: 11.46%

Bethesda, Maryland
3-year percent change in mean household income (2019-2022): 18.78%
3-year percent change in population with income of $200K+: 11.30%
Try This: 7 Things You Must Buy at Costco While on a Retirement Budget
Ridgewood, New Jersey
3-year percent change in mean household income (2019-2022): 12.15%
3-year percent change in population with income of $200K+: 10.74%

Potomac, Maryland
3-year percent change in mean household income (2019-2022): 13.35%
3-year percent change in population with income of $200K+: 10.12%
Learn More: Cutting Expenses in Retirement: 6 Home Items to Stop Buying
Southlake, Texas
3-year percent change in mean household income (2019-2022): 20.17%
3-year percent change in population with income of $200K+: 9.91%
Highland Park, Illinois
3-year percent change in mean household income (2019-2022): 4.78%
3-year percent change in population with income of $200K+: 9.16%
Check Out: 15 Cheap, Beautiful Places To Retire
Milton, Georgia
3-year percent change in mean household income (2019-2022): 8.65%
3-year percent change in population with income of $200K+: 8.09%
Mountain Brook, Alabama
3-year percent change in mean household income (2019-2022): 12.05%
3-year percent change in population with income of $200K+: 7.67%
Find Out: Social Security: How Long You Can Live Outside the US Without Losing Benefits
Laguna Beach, California
3-year percent change in mean household income (2019-2022): 11.67%
3-year percent change in population with income of $200K+: 7.58%
North Potomac, Maryland
3-year percent change in mean household income (2019-2022): 8.86%
3-year percent change in population with income of $200K+: 7.51%
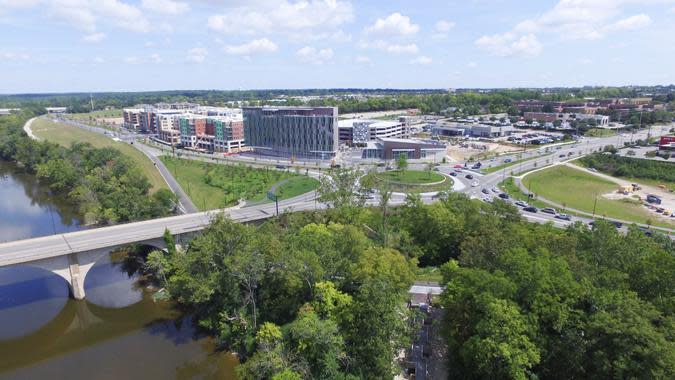
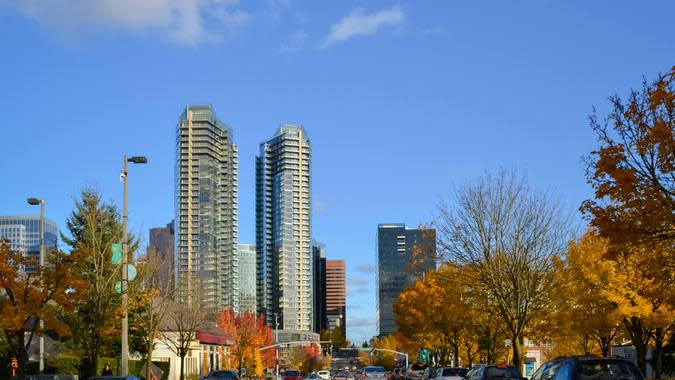
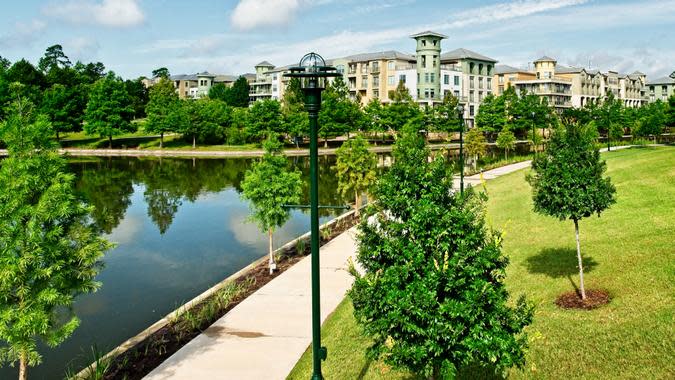
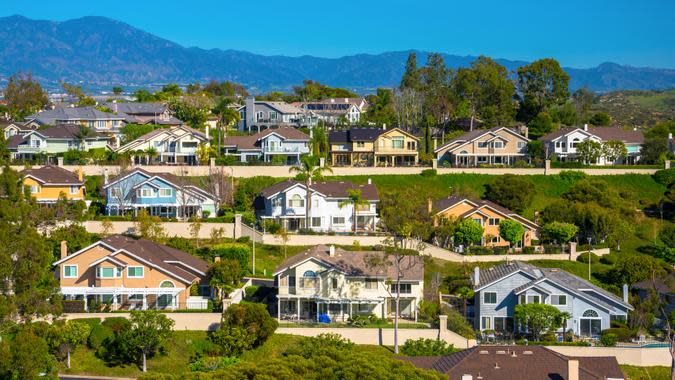
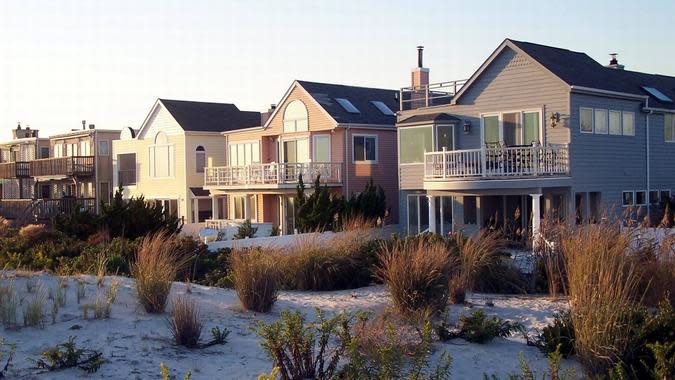
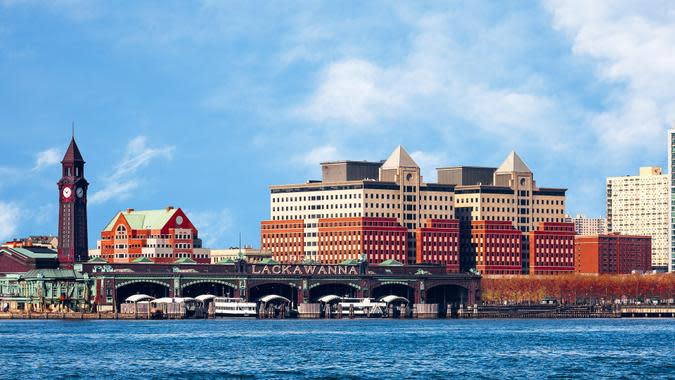
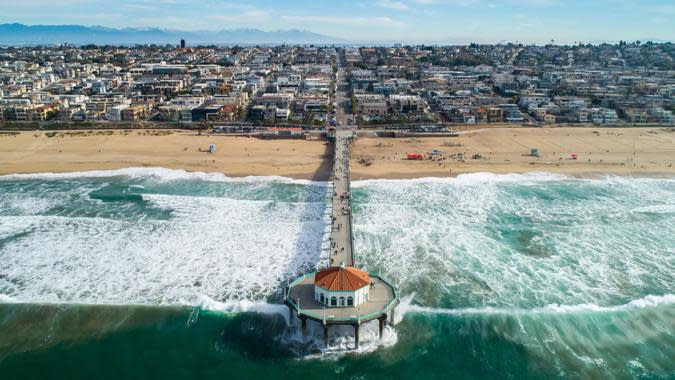
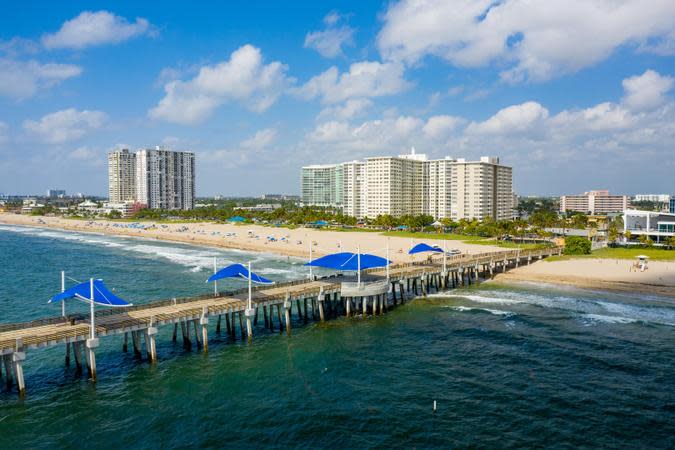
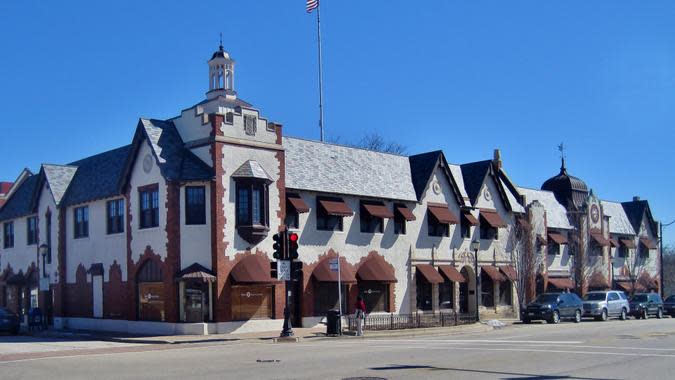
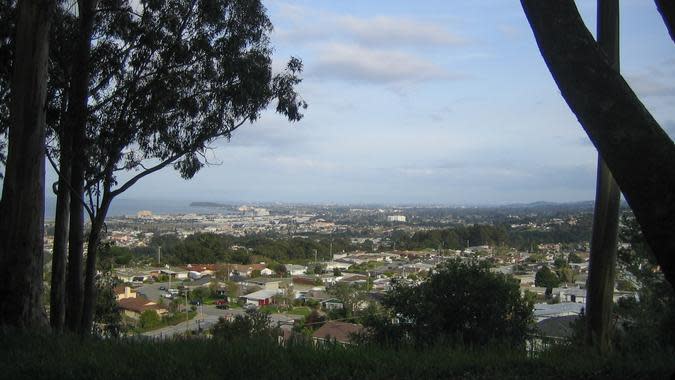
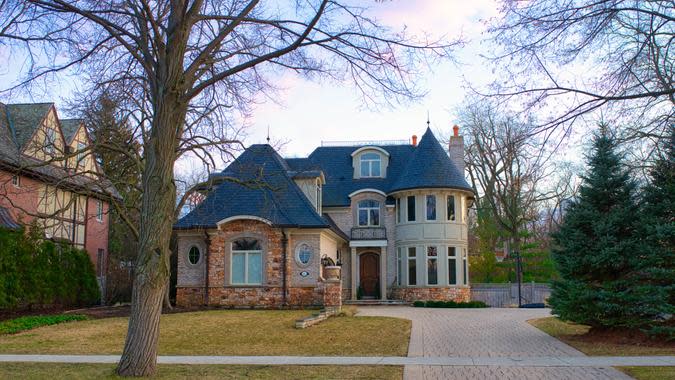
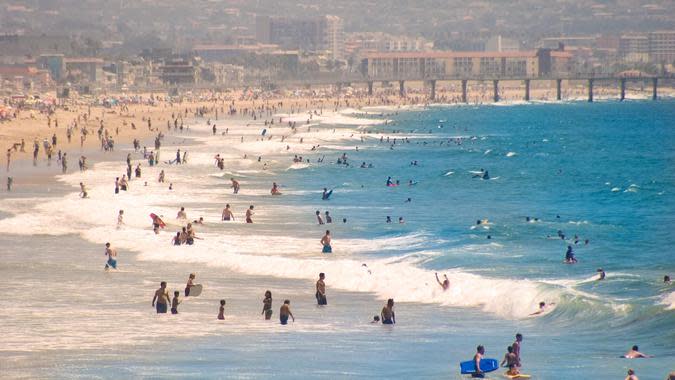
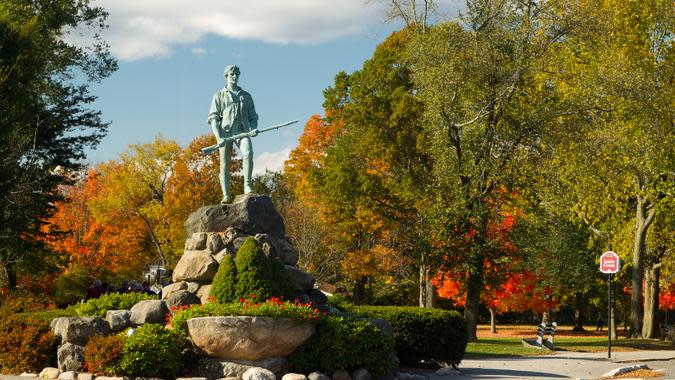
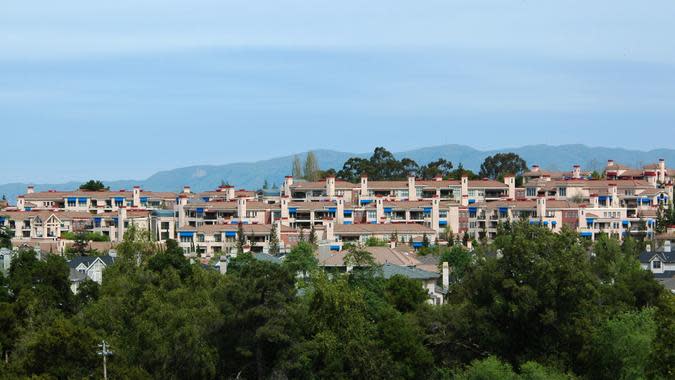
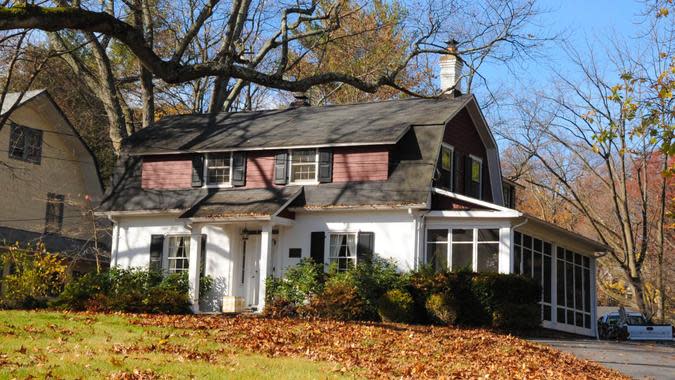
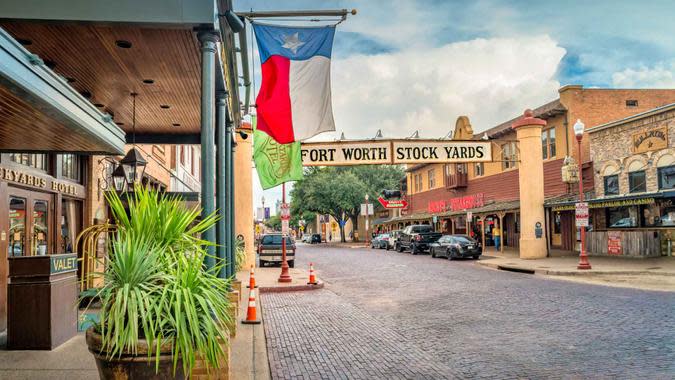
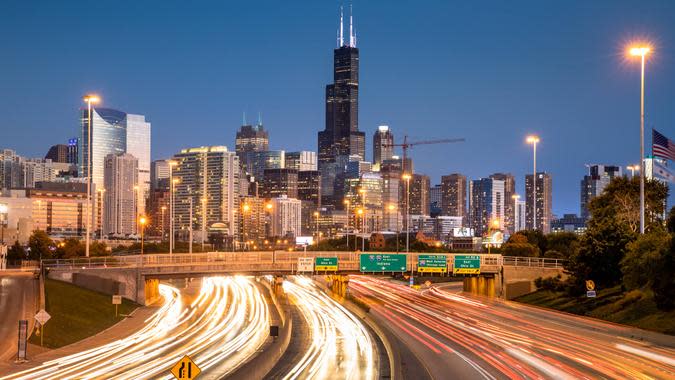
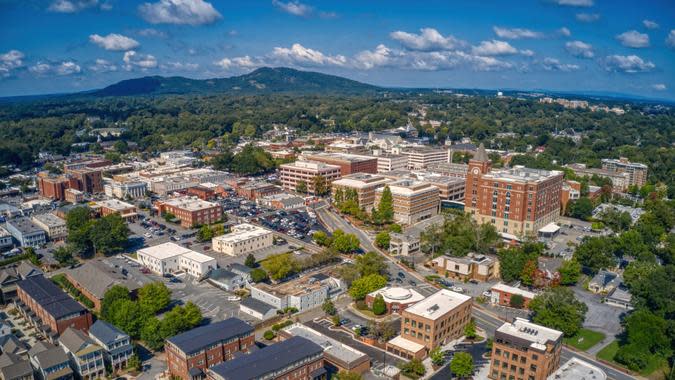
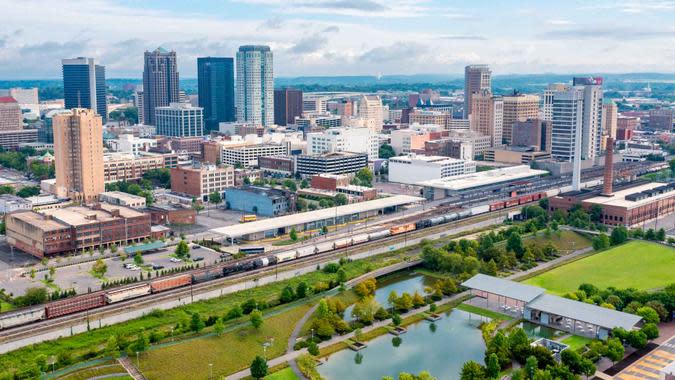
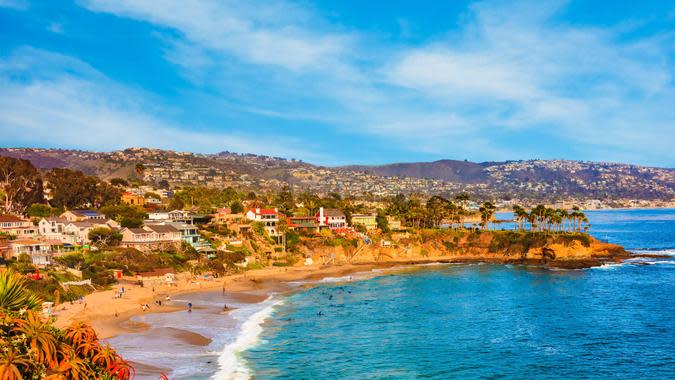
Photo disclaimer: Photos are for illustrative purposes only. In many cases, the closest major city outside of the city/county mentioned in the article was used.
Methodology: For this piece, GOBankingRates first took the 100 cities with the highest mean household income and with a minimum of 7,500 total households, sourced from the 2022 American Community Survey as conducted by the U.S. Census Bureau. With these cities selected, GOBankingRates then found each city’s: (1) 2019 mean household income; (2) 2022 mean household income; (3) three-year percent change in mean household income; (4) 2019 percent of population with a household income of $200,000+; (5) 2022 percent of population with a household income of $200,000+; and (6) three-year percent change in population with a household income of $200,000+. All data was collected and is up to date as of Feb. 7, 2024.
More From GOBankingRates
This article originally appeared on GOBankingRates.com: Wealth in America: 50 Cities Where the Upper Class Is Growing the Most
