What those hurricane spaghetti models all over social media actually mean
Whenever the tropics start firing up and a distant storm enters the horizon, social media is flooded with maps of the Atlantic Basin covered in a noodly mess of multicolored lines affectionately known as spaghetti models.
The origin of the name is obvious. Their importance as a forecasting tool — far less clear to amateurs.
Each of the colored strands represents a prediction for the path of a storm, developed by some of the fastest supercomputers in the world. They suck in incredible amounts of data from satellites, sea surface temperatures and the slightest change in wind patterns and spit out projections.
The more confidence in the prediction, the closer together the lines will be.
But these supercomputers are not oracles. They get it wrong — often. They’re crunching data from some models providing limited information, like past tracks, while ignoring critical things like atmospheric currents that steer hurricanes. Forecasters use the assorted models as guidance, especially when watching for changes over time, like if all the models shift further west or show the storm getting much stronger.
With Fiona departing, all eyes on a tropical wave to the south. Could it affect Florida?
Each line can represent a single run of a computer model, so the spray of spaghetti can represent one computer model’s 50 different guesses at where a storm might go, sometimes as far as 10 days in the future.
That’s one of the reasons why you shouldn’t panic if you see a single line directly over your corner of the state. Weather experts, like Florida’s State Climatologist David Zierden, strongly warn against using these images to make decisions about storms.
“Us armchair meteorologists don’t have the expertise to really evaluate all the models in detail and make that determination, but guess what? The National Hurricane Center does have that expertise,” he said. “Don’t try to draw any conclusions from these spaghetti models. Listen to the experts at the NHC.”
Bare bones info
One reason not to trust a spaghetti plot? They don’t actually say much.
The lines are formed by plotting the spots where the center of the storm could be over time. Impacts like high winds and rain can spread very far from the center, which means spaghetti models are a bad way to figure out how a potential storm could affect an area. They don’t show how big a storm is, where its winds and rainstorms are or how strong it is.
And because these models rely so heavily on the center of a storm for tracking, they struggle to accurately predict what disorganized tropical storms, tropical depressions or even tropical waves might do in the future.
“When we get farther away from the current day, you see the lines start going everywhere. It’s important for people to realize that the farther you get out, the greater the errors are,” said senior meteorologist for Accuweather Mike Doll.
Once a storm has a center, the predictions get far more accurate and the lines clump together. The center mass of trusted spaghetti models usually forms the middle line of the infamous hurricane center “cone of uncertainty.”
Keyword: trusted. Not all hurricane models are created equal, and there’s no single model that’s always more accurate than the rest. They’re known to trade off from season to season, all the more reason meteorologists don’t focus on just one.
“I get the question from family and friends, which model is the best?” Zierden said. “Some models have a history of performing better than others, but for a given situation, it depends on which model is handling that situation the best.”
GFS vs. Euro
The two most popular models are the GFS and the ECMWF (or Euro), run respectively by the American government and a collaboration of European governments. There are also the Canadian Meteorological Center (CMC) and United Kingdom Meteorological (UKMET) models.
Those models project weather for the entire globe, while models like the HWRF and HMON are used just for hurricanes.
They’re all dynamical models, which are the output of supercomputers and are usually run every six hours for the freshest results.
The ‘cone of uncertainty’ is getting smaller — but it still matters if you’re outside it
The other two types of models are statistical models, which are backward-looking and focus on historic storm behavior around specific times and places and ensemble, also known as consensus, models, which integrate multiple runs from a single model.
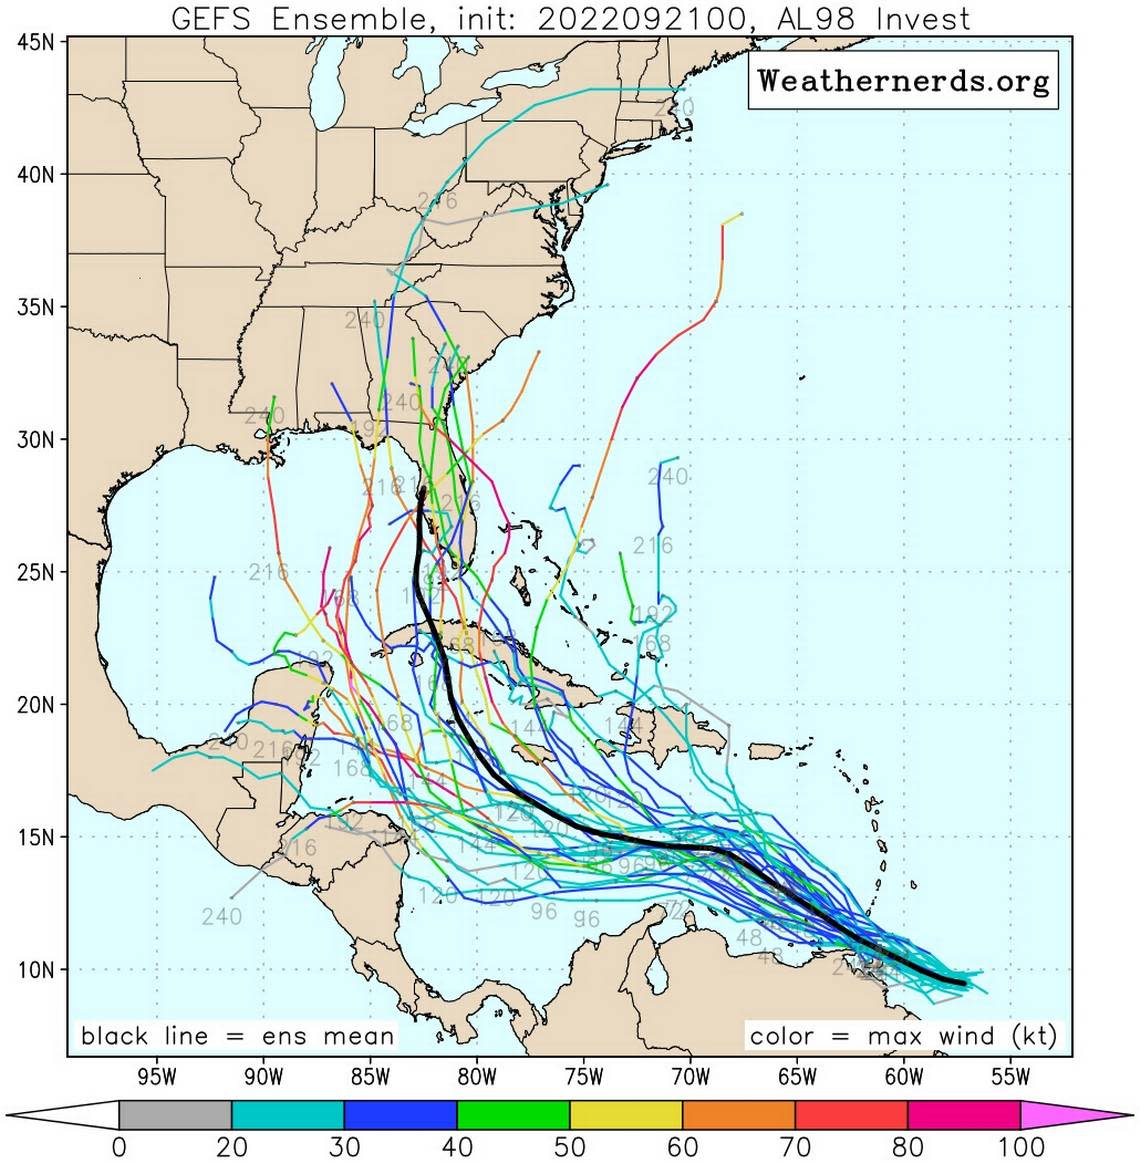
The most popular consensus models are the GEFS, which includes several runs of the American GFS model, and the EEMN, which does the same thing for the Euro.
Meteorologists like Jeff George, director of the Florida Public Radio Emergency Network, generally prefer these types of models because they show a range of potential futures that can hinge on minute changes, like a dew point running a few degrees higher.
“Even though all those spaghetti models have different strengths and weaknesses and are run at different times, you never want to look at just one,” he said. “They will run the model and then 10 minutes later, don’t even introduce any new data, and they’ll run it and get a different output. That’s what ensembles do. They introduce uncertainty into the model.”
George noted that trained and trusted meteorologists, like those at the NHC and the National Weather Service, have spent years learning the biases and mistakes in various models. They know how to sift through satellite data, heat maps and wind charts to determine where a storm might head and what impacts it might bring.
“You really hate to tell people “we need to wait, we need to wait, we need to wait,” but if you want the safest info, the safest forecast that’s the most reliable, you do have to wait,” he said.
