States Whose Economies Are Failing vs. States Whose Economies Are Thriving

The U.S. economy has seen more fluctuation over the past three years than in many decades prior. The coronavirus pandemic brought the economy to a near halt in 2020, when the unemployment rate shot up to an all-time record of 14.7% in April 2020. Both the overall rate of 14.7% and the 10.3% jump from the prior month were the highest on record since the Bureau of Labor Statistics began keeping statistics in January 1948.
Student Loans: DOJ Says Overruling Biden's Forgiveness Could Lead to Lawsuits Over 'Virtually All Federal Action'
Find Out: 4 Reasons You Should Cancel Amazon Prime
Advice: 3 Things You Must Do When Your Savings Reach $50,000
While the economy began to stabilize, both in terms of the unemployment rate and year-over-year GDP, that didn't entirely last in every part of the country. The country has suffered from record inflation highs, driven by such factors as: supply chain problems that raised the costs of goods, a temporary surge in spending due to government stimulus money, and ultimately the Fed raising interest rates, according to Fortune. Some states have already made a rebound almost all the way back to pre-pandemic levels, while others have continued to struggle to return to a state of balance.
To determine which economies are thriving and which are failing, GOBankingRates took a look at a variety of economic factors, from year-over-year GDP and unemployment rates to wage changes and the percentage of a state's population that is living in poverty. States were divided into the top 15 and the bottom 15. Read on to find out which states are at the bottom and the top of this split recovery.

States Whose Economies Are Failing
These states are struggling to get over the recent economic challenges. Although overall unemployment trends are improving, residents of these states are still having trouble finding jobs and contributing to the state's GDP.
Take Our Poll: What's the First Thing You Would Do If You Won a Big Lottery Jackpot?
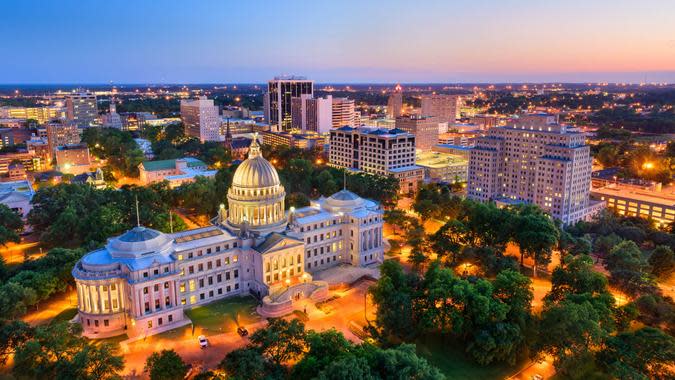
1. Mississippi
October 2022 unemployment rate: 3.8%
Q2 2022 GDP per capita growth rate: $46,833.10
GDP growth Q2, 2022: 5.1%
Average weekly wages Q1, 2022: $879
Percent change in average weekly wages Q1 2021 to Q2 2022: 8.5%
Percent of population below poverty line 2021: 19.4
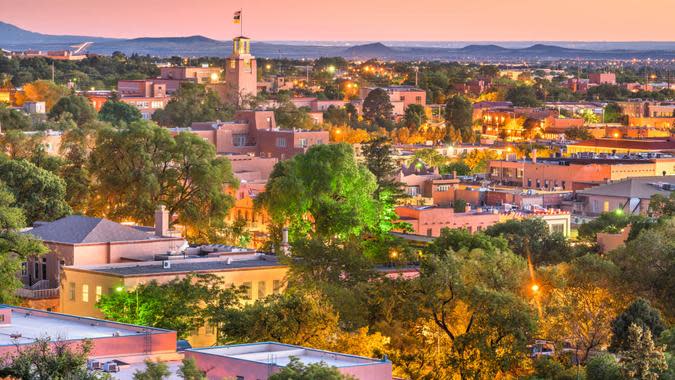
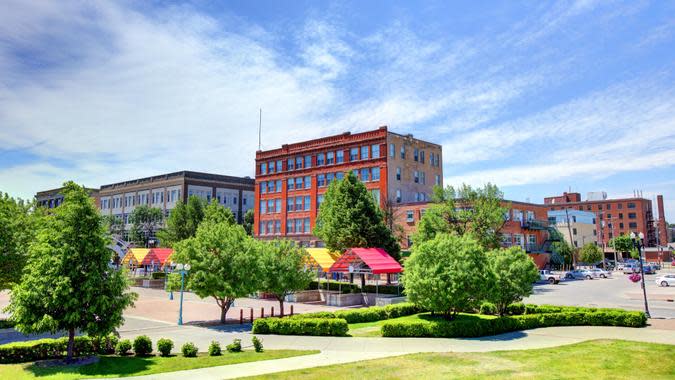
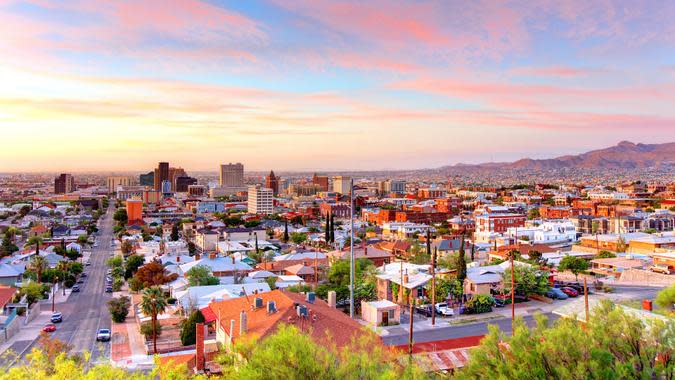
2. New Mexico
October 2022 unemployment rate: 4.3%
Q2 2022 GDP per capita growth rate: $57,828.98
GDP growth Q2, 2022: 3.2%
Average weekly wages Q1, 2022: $1,018
Percent change in average weekly wages Q1 2021 to Q2 2022: 6.5%
Percent of population below poverty line 2021: 18.4

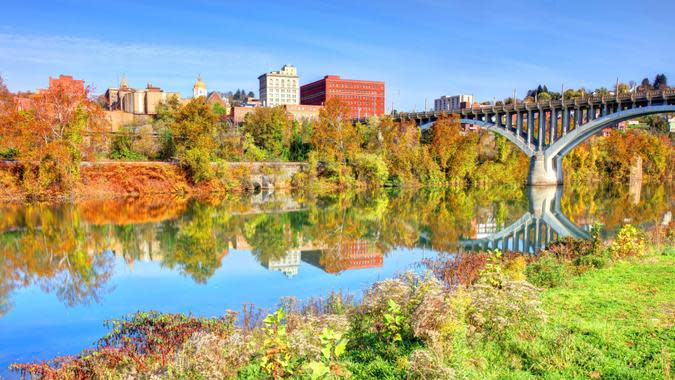
3. West Virginia
October 2022 unemployment rate: 4.0%
Q2 2022 GDP per capita growth rate: $54,249.14
GDP growth Q2, 2022: 5.7%
Average weekly wages Q1, 2022: $968
Percent change in average weekly wages Q1 2021 to Q2 2022: 6.1%
Percent of population below poverty line 2021: 16.8

4. Maryland
October 2022 unemployment rate: 4.5%
Q2 2022 GDP per capita growth rate: $75,527.21
GDP growth Q2, 2022: 4.6%
Average weekly wages Q1, 2022: $1,410
Percent change in average weekly wages Q1 2021 to Q2 2022: 2%
Percent of population below poverty line 2021: 10.3
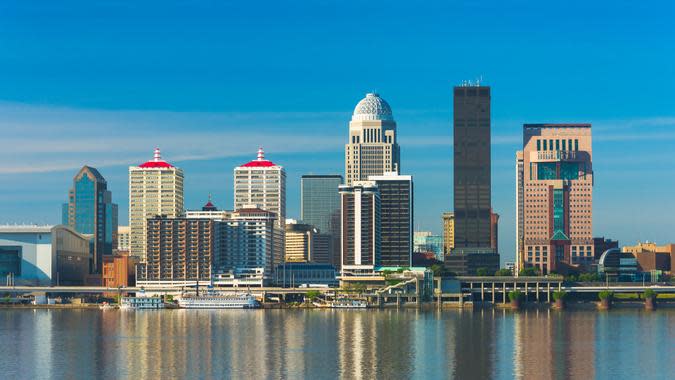
5. Kentucky
October 2022 unemployment rate: 3.9%
Q2 2022 GDP per capita growth rate: $57,278.87
GDP growth Q2, 2022: 3.7%
Average weekly wages Q1, 2022: $1,038
Percent change in average weekly wages Q1 2021 to Q2 2022: 7.6%
Percent of population below poverty line 2021: 16.5
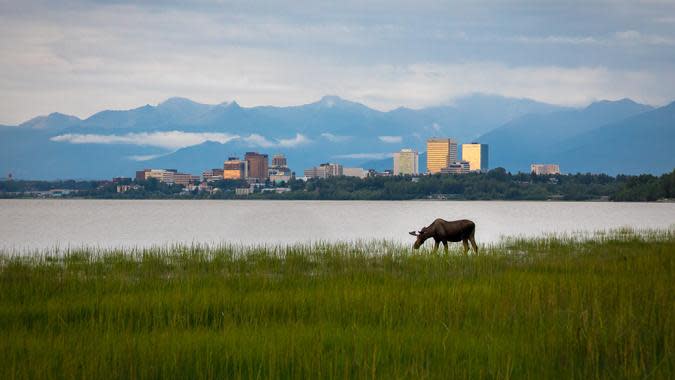
6. Alaska
October 2022 unemployment rate: 4.5%
Q2 2022 GDP per capita growth rate: $87,702.15
GDP growth Q2, 2022: 5.2%
Average weekly wages Q1, 2022: $1,178
Percent change in average weekly wages Q1 2021 to Q2 2022: 4.9%
Percent of population below poverty line 2021: 10.5
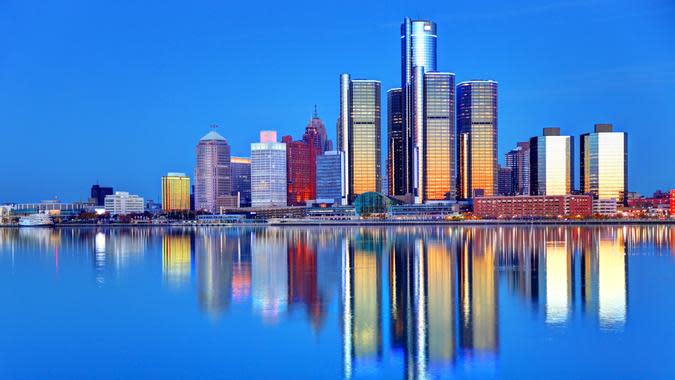
7. Michigan
October 2022 unemployment rate: 4.2%
Q2 2022 GDP per capita growth rate: $61,229.69
GDP growth Q2, 2022: 4.4%
Average weekly wages Q1, 2022: $1,225
Percent change in average weekly wages Q1 2021 to Q2 2022: 6.2%
Percent of population below poverty line 2021: 13.1

8. Louisiana
October 2022 unemployment rate: 3.3%
Q2 2022 GDP per capita growth rate: $60,779.44
GDP growth Q2, 2022: 5.8%
Average weekly wages Q1, 2022: $1,058
Percent change in average weekly wages Q1 2021 to Q2 2022: 8.6%
Percent of population below poverty line 2021: 19.6

9. Oklahoma
October 2022 unemployment rate: 3.4%
Q2 2022 GDP per capita growth rate: $60,778.77
GDP growth Q2, 2022: 6.3%
Average weekly wages Q1, 2022: $1,012
Percent change in average weekly wages Q1 2021 to Q2 2022: 8.0%
Percent of population below poverty line 2021: 15.6

10. Ohio
October 2022 unemployment rate: 4.2%
Q2 2022 GDP per capita growth rate: $69,407.96
GDP growth Q2, 2022: 5.8%
Average weekly wages Q1, 2022: $1,179
Percent change in average weekly wages Q1 2021 to Q2 2022: 7.5%
Percent of population below poverty line 2021: 13.4

11. Nevada
October 2022 unemployment rate: 4.6%
Q2 2022 GDP per capita growth rate: $67,878.69
GDP growth Q2, 2022: 5.8%
Average weekly wages Q1, 2022: $1,164
Percent change in average weekly wages Q1 2021 to Q2 2022: 8.0%
Percent of population below poverty line 2021: 14.1

12. District of Columbia
October 2022 unemployment rate: 4.8%
Q2 2022 GDP per capita growth rate: $239,874.64
GDP growth Q2, 2022: 3.6%
Average weekly wages Q1, 2022: $2,139
Percent change in average weekly wages Q1 2021 to Q2 2022: 2.0%
Percent of population below poverty line 2021: 16.5

13. California
October 2022 unemployment rate: 4.0%
Q2 2022 GDP per capita growth rate: $90,690.83
GDP growth Q2, 2022: 4.9%
Average weekly wages Q1, 2022: $1,644
Percent change in average weekly wages Q1 2021 to Q2 2022: 1.0%
Percent of population below poverty line 2021: 12.3
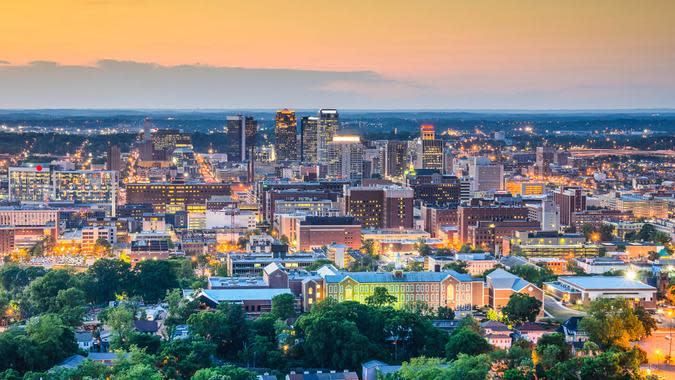
14. Alabama
October 2022 unemployment rate: 2.7%
Q2 2022 GDP per capita growth rate: $54,643.40
GDP growth Q2, 2022: 5.9%
Average weekly wages Q1, 2022: $1,072
Percent change in average weekly wages Q1 2021 to Q2 2022: 8.2%
Percent of population below poverty line 2021: 16.1
15. Pennsylvania
October 2022 unemployment rate: 4.0%
Q2 2022 GDP per capita growth rate: $70,612.47
GDP growth Q2, 2022: 4.3%
Average weekly wages Q1, 2022: $1,309
Percent change in average weekly wages Q1 2021 to Q2 2022: 6.9%
Percent of population below poverty line 2021: 12.1

States Whose Economies Are Thriving
If you live in one of these states, you've probably noticed the signs of economic improvement. Unemployment and GDP levels are recovering nicely in these areas. Here's a look at the 15 states helping to lead America as a whole back to a full recovery.
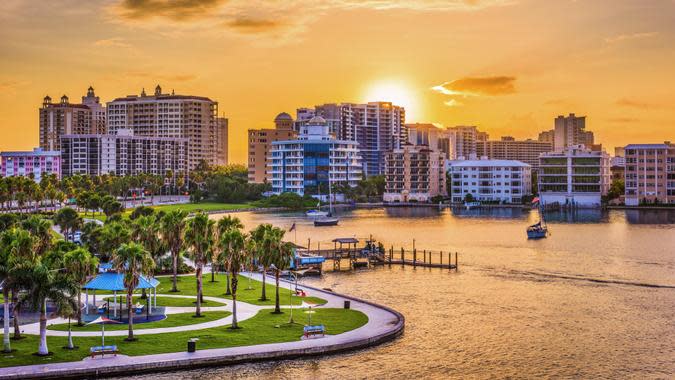
1. Florida
October 2022 unemployment rate: 2.7%
Q2 2022 GDP per capita growth rate: $62,965.88
GDP growth Q2, 2022: 7.6%
Average weekly wages Q1, 2022: $1,222
Percent change in average weekly wages Q1 2021 to Q2 2022: 10.8%
Percent of population below poverty line 2021: 13.1
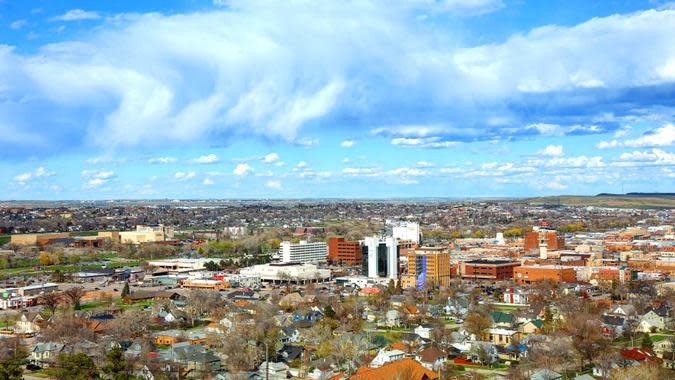
2. North Dakota
October 2022 unemployment rate: 2.3%
Q2 2022 GDP per capita growth rate: $96,451.63
GDP growth Q2, 2022: 10.9%
Average weekly wages Q1, 2022: $1,106
Percent change in average weekly wages Q1 2021 to Q2 2022: 6.9%
Percent of population below poverty line 2021: 11.1

3. Utah
October 2022 unemployment rate: 2.1%
Q2 2022 GDP per capita growth rate: $73,646.75
GDP growth Q2, 2022: 6.5%
Average weekly wages Q1, 2022: $1,152
Percent change in average weekly wages Q1 2021 to Q2 2022: 8.2%
Percent of population below poverty line 2021: 8.6

4. Nebraska
October 2022 unemployment rate: 2.4%
Q2 2022 GDP per capita growth rate: $82,120.82
GDP growth Q2, 2022: 8.5%
Average weekly wages Q1, 2022: $1,079
Percent change in average weekly wages Q1 2021 to Q2 2022: 9.2%
Percent of population below poverty line 2021: 10.8

5. Minnesota
October 2022 unemployment rate: 2.1%
Q2 2022 GDP per capita growth rate: $77,535.97
GDP growth Q2, 2022: 5.4%
Average weekly wages Q1, 2022: $1,374
Percent change in average weekly wages Q1 2021 to Q2 2022: 6.8%
Percent of population below poverty line 2021: 9.3

6. Colorado
October 2022 unemployment rate: 3.6%
Q2 2022 GDP per capita growth rate: $82,729.23
GDP growth Q2, 2022: 6.5%
Average weekly wages Q1, 2022: $1,455
Percent change in average weekly wages Q1 2021 to Q2 2022: 8.8%
Percent of population below poverty line 2021: 9.7
7. Texas
October 2022 unemployment rate: 4.0%
Q2 2022 GDP per capita growth rate: $79,736.51
GDP growth Q2, 2022: 9.3%
Average weekly wages Q1, 2022: $1,369
Percent change in average weekly wages Q1 2021 to Q2 2022: 8.7%
Percent of population below poverty line 2021: 14.2

8. New Hampshire
October 2022 unemployment rate: 2.4%
Q2 2022 GDP per capita growth rate: $74,998.27
GDP growth Q2, 2022: 4.5%
Average weekly wages Q1, 2022: $1,361
Percent change in average weekly wages Q1 2021 to Q2 2022: 7.8%
Percent of population below poverty line 2021: 7.2
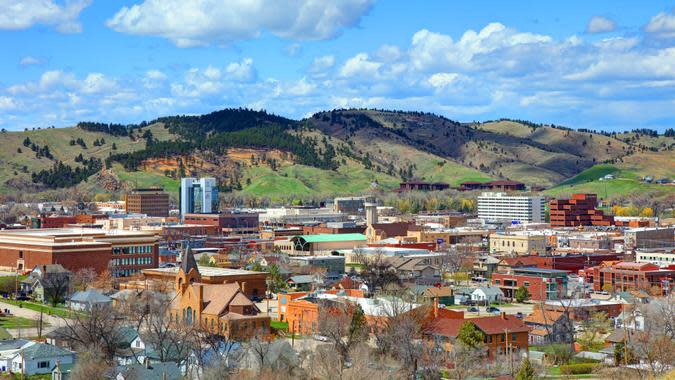
9. South Dakota
October 2022 unemployment rate: 2.4%
Q2 2022 GDP per capita growth rate: $75,375.04
GDP growth Q2, 2022: 9.4%
Average weekly wages Q1, 2022: $1,012
Percent change in average weekly wages Q1 2021 to Q2 2022: 8.6%
Percent of population below poverty line 2021: 12.3
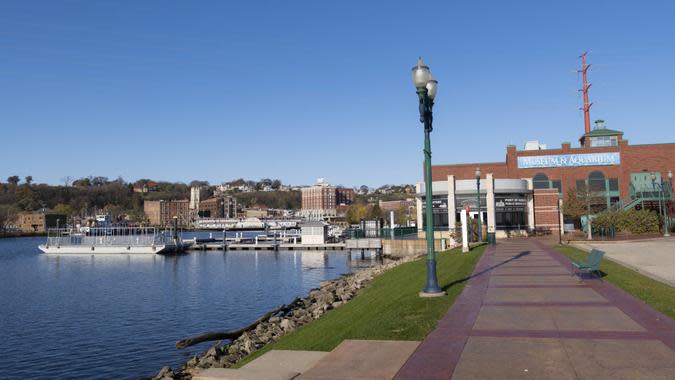
10. Iowa
October 2022 unemployment rate: 2.9%
Q2 2022 GDP per capita growth rate: $72,063.36
GDP growth Q2, 2022: 9.3%
Average weekly wages Q1, 2022: $1,080
Percent change in average weekly wages Q1 2021 to Q2 2022: 7.6%
Percent of population below poverty line 2021: 11.1

11. Georgia
October 2022 unemployment rate: 2.9%
Q2 2022 GDP per capita growth rate: $69,218.99
GDP growth Q2, 2022: 5.6%
Average weekly wages Q1, 2022: $1,301
Percent change in average weekly wages Q1 2021 to Q2 2022: 8.8%
Percent of population below poverty line 2021: 14

12. Massachusetts
October 2022 unemployment rate: 3.5%
Q2 2022 GDP per capita growth rate: $97,229.63
GDP growth Q2, 2022: 3.0%
Average weekly wages Q1, 2022: $1,827
Percent change in average weekly wages Q1 2021 to Q2 2022: 5.9%
Percent of population below poverty line 2021: 10.4
13. Virginia
October 2022 unemployment rate: 2.7%
Q2 2022 GDP per capita growth rate: $74,373.37
GDP growth Q2, 2022: 4.9%
Average weekly wages Q1, 2022: $1,366
Percent change in average weekly wages Q1 2021 to Q2 2022: 6.6%
Percent of population below poverty line 2021: 10.2
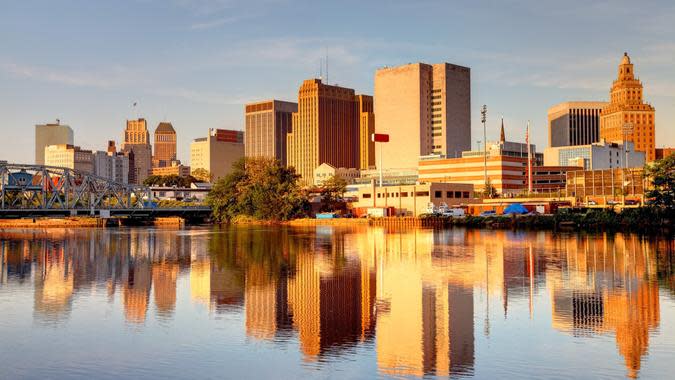
14. New Jersey
October 2022 unemployment rate: 3.5%
Q2 2022 GDP per capita growth rate: $79,598.97
GDP growth Q2, 2022: 5.6%
Average weekly wages Q1, 2022: $1,606
Percent change in average weekly wages Q1 2021 to Q2 2022: 4.6%
Percent of population below poverty line 2021: 10.2

15. New York
October 2022 unemployment rate: 4.4%
Q2 2022 GDP per capita growth rate: $102,587.26
GDP growth Q2, 2022: 7.2%
Average weekly wages Q1, 2022: $1,972
Percent change in average weekly wages Q1 2021 to Q2 2022: 5.6%
Percent of population below poverty line 2021: 13.9
More From GOBankingRates
Methodology: GOBankingRates analyzed the following seven factors for each state and the District of Columbia to gauge the health of their economies: (1) the October 2022 unemployment rate according to the Burea of Labor Statistics' (BLS) Local Area Unemployment Statistics data; (2) the year-over-year change in nonfarm payroll jobs as of October 2022 according to the BLS's State and Metro Area Employment, Hours, & Earnings data; (3) the Q2 2022 GDP per capita in current dollars, calculated by using population data from the Census Bureau's American Community Survey (ACS) 2021 estimates and the Bureau of Economic Analysis's (BEA) most recent GDP by State release; (4) the percent by which GDP grew between the first and second quarters of 2022, also according to the BEA's GDP release; (5) the average weekly wage in March 2022 according to the BLS's Economic News Release; (6) the percent change in the average weekly wage between March 2021 and March 2022, also according to the BLS Economic News Release; and (7) the percent of the population that was living below the poverty line in 2021, according to the Census Bureau's 2021 ACS 1-year data. States were scored on all factors and ranked against each other based on their combined total
score. The states with the lowest combined scores were identified as states with thriving economies and the states with the highest combined scores were identified as states with failing economies. All data was collected on and up to date as of November 28, 2022.
This article originally appeared on GOBankingRates.com: States Whose Economies Are Failing vs. States Whose Economies Are Thriving
