This Southwest State is the #1 Deadliest for Senior Drivers

How many elderly drivers are on the road?
Over 45 million licensed drivers are aged 65 or over, says the latest 2018 Highway Statistics report from the U.S. Department of Transportation Federal Highway Administration (FHWA). To put that number into perspective, that means 1 out of every 5 drivers hitting U.S. roads are in this age group.
What’s more, the number of senior drivers has increased by 69% from 1999 to 2018. That’s an average annual increase of over 3.5% more seniors driving on the road.

Which state has the most senior drivers?
West Virginia sees the greatest percentage of senior drivers, with 27% of this state’s licensed drivers over the age of 65. This may be attributed to a rise in its senior population, translating to more senior drivers on the road.
The same goes for places like Florida and Maine — states with an older average population tend to have more senior drivers.
Which state has the fewest senior drivers?
Utah has the lowest percentage of senior drivers, with only 15% of licensed drivers over the age of 65, according to FHWA highway stats. This small percentage makes sense since there’s a lower percentage of people 65 and older overall living in Utah.
Although not a state, Washington D.C. holds an even lower percentage of senior drivers than Utah, with only 14% of licensed drivers at age 65 or older.

How often are senior citizens involved in car accidents?
Over 8,100 adults aged 65 or older were killed in motor vehicle crashes in 2018. Another estimated 212,000 seniors needed emergency care for non-fatal injuries.
Seniors as a whole experience a higher death rate due to car accidents. Those aged 65 and older had a vehicular death rate of 15.52 per 100,000 persons in 2018. Seniors 80 and older had the highest death rate at 20.21, which is nearly 77% higher than the national average of 12.13. Those younger than 65 had a much lower death rate of 11.48 per 100,000 persons.
That means 22 seniors died in car crashes every day on average, and another 580 were injured each day. But these stats don’t reflect who’s at fault for the accidents, only who’s being killed in car crashes.
Why are seniors facing higher death rates in car crashes? Seniors are more at risk of injury and it’s harder for seniors to recover after being injured in an accident. Age-related changes to vision, memory or decision-making may affect driving skills or the quick reaction needed to prevent a crash.

Which age group causes the most fatal car accidents?
According to the National Highway Traffic Safety Administration, drivers younger than 40 had the highest involvement rate in fatal crashes in 2017, with 28.89 drivers involved in fatal crashes per 100,000 drivers.
Though senior drivers are more at risk in a car accident, they’re not necessarily worse drivers than those in other age groups. The age group with the lowest rate of driver involvement in fatal crashes were those 65 to 69, who had 14.82 drivers involved in fatal crashes per 100,000 drivers.
However, drivers older than 69 saw an increase in the rate of involvement in fatal crashes of about 11% every five years.

Are men or women more likely to be involved in a deadly car crash?
No matter the age group, men were shown to have higher death rates than women. In 2018, there were 28,149 deaths due to motor vehicle accidents among men, compared to 11,527 deaths among women. That’s more than twice as many men dying due to a crash than women.

Not all bad news for elderly drivers: Motor vehicle death rate is steadily dropping.
The number of elderly drivers has been steadily increasing over time, with 45 million seniors licensed to drive in 2018. Even with more seniors hitting the road, the motor vehicle death rate among the elderly has actually decreased by 30.78% since 1999. The motor vehicle death rate per 100,000 people among the elderly was 22.42 in 1999 and decreased to 15.52 in 2018.
Which states are the deadliest for senior drivers?
The deadliest state for seniors when it comes to vehicular deaths is Oklahoma, with a death rate of 24.7 people per 100,000 seniors. A close second is Alabama, with a death rate of 24.6, closely followed by Mississippi’s 24.5.
On the flip side, the safest state for senior drivers is Rhode Island, with a death rate of 6.6 per 100,000 older people.
Characteristics of the safest states for driving could be the reason for fewer deadly accidents. Those may include a lower population in Rhode Island and robust public transit systems in parts of New York and Massachusetts. In either case, fewer seniors driving could indicate a reason for fewer deadly accidents.
Here are the top ten most dangerous states for senior drivers.

10. North Carolina
Senior population: 1,689,265
Senior death rate per 100,000 seniors: 328
Senior death rate by motor vehicle per 100,000 seniors: 19.42
9. North Dakota
Senior population: 116,637
Senior death rate per 100,000 seniors: 24
Senior death rate by motor vehicle per 100,000 seniors: 20.58

8. Kentucky
Senior population: 730,626
Senior death rate per 100,000 seniors: 153
Senior death rate by motor vehicle per 100,000 seniors: 20.94

7. Arkansas
Senior population: 511,827
Senior death rate per 100,000 seniors: 108
Senior death rate by motor vehicle per 100,000 seniors: 21.10

6. South Dakota
Senior population: 146,854
Senior death rate per 100,000 seniors: 31
Senior death rate by motor vehicle per 100,000 seniors: 21.11
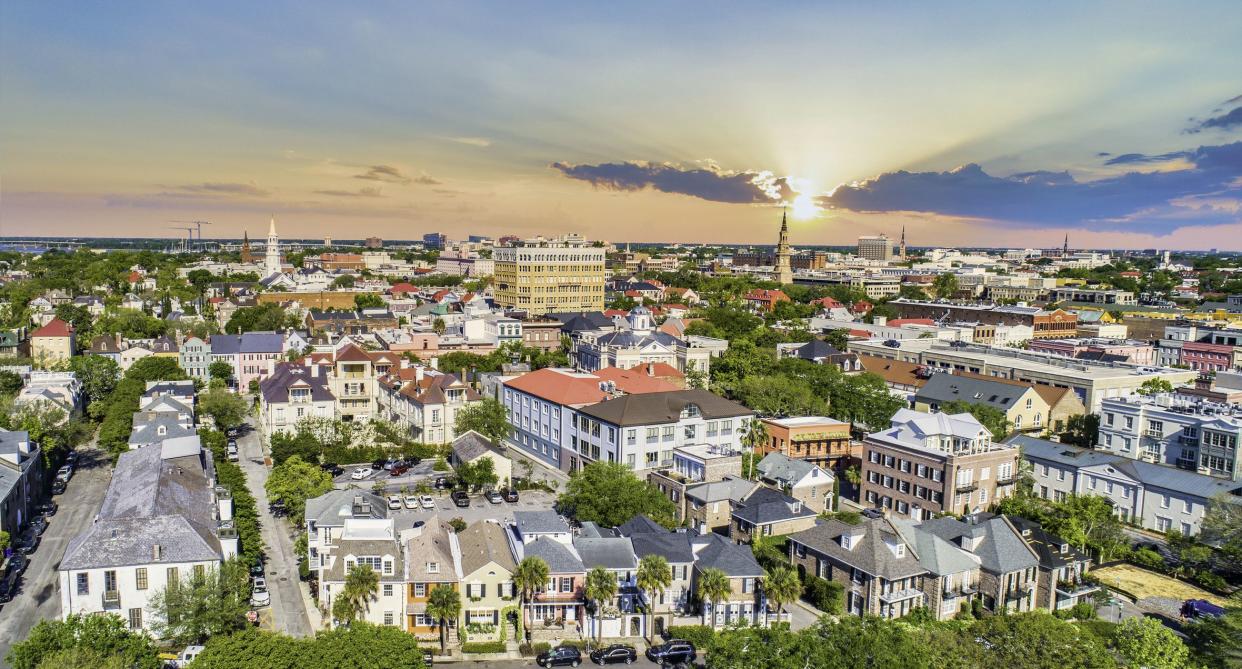
5. South Carolina
Senior population: 899,915
Senior death rate per 100,000 seniors: 204
Senior death rate by motor vehicle per 100,000 seniors: 22.67

4. West Virginia
Senior population: 359,878
Senior death rate per 100,000 seniors: 83
Senior death rate by motor vehicle per 100,000 seniors: 23.06

3. Mississippi
Senior population: 474,475
Senior death rate per 100,000 seniors: 116
Senior death rate by motor vehicle per 100,000 seniors: 24.45

2. Alabama
Senior population: 826,894
Senior death rate per 100,000 seniors: 203
Senior death rate by motor vehicle per 100,000 seniors: 24.55

1. Oklahoma
Senior population: 619,553
Senior death rate per 100,000 seniors: 153
Senior death rate by motor vehicle per 100,000 seniors: 24.70

Methodology
Our experts sourced motor vehicle crash data from the Web-based Injury Statistics Query and Reporting System (WISQARS) by the Centers for Disease Control and Prevention. We looked at fatal and non-fatal injury reports, with motor vehicle traffic (categorized by injured person) selected as the cause of injuries.
The terms elderly, senior and older adults refer to people aged 65 years or older, unless a specific age group is mentioned. Death rate refers to the crude death rate, which counts how many deaths happened each year for every 100,000 people in the selected population. Driver involvement in fatal crashes refers to the crude involvement rates in fatal crashes by driver, which counts the number of drivers involved in fatal traffic crashes every year for every 100,000 licensed drivers in the selected population.
This article originally appeared on Finder. and was syndicated by MediaFeed.
