With An ROE Of 32.20%, Has Canadian National Railway Company’s (TSE:CNR) Management Done Well?

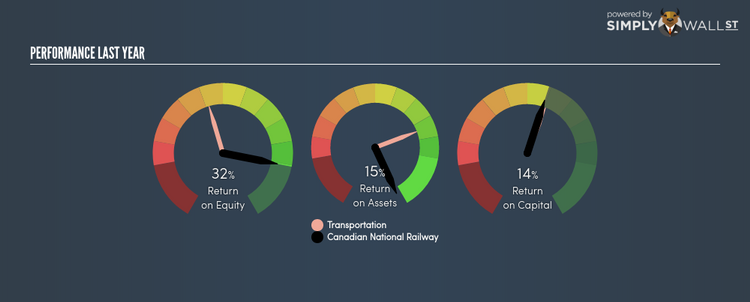
Canadian National Railway Company (TSX:CNR) outperformed the Railroads industry on the basis of its ROE – producing a higher 32.20% relative to the peer average of 11.19% over the past 12 months. Superficially, this looks great since we know that CNR has generated big profits with little equity capital; however, ROE doesn’t tell us how much CNR has borrowed in debt. We’ll take a closer look today at factors like financial leverage to determine whether CNR’s ROE is actually sustainable. Check out our latest analysis for Canadian National Railway
Breaking down ROE — the mother of all ratios
Return on Equity (ROE) is a measure of Canadian National Railway’s profit relative to its shareholders’ equity. For example, if the company invests CA$1 in the form of equity, it will generate CA$0.32 in earnings from this. Generally speaking, a higher ROE is preferred; however, there are other factors we must also consider before making any conclusions.
Return on Equity = Net Profit ÷ Shareholders Equity
ROE is assessed against cost of equity, which is measured using the Capital Asset Pricing Model (CAPM) – but let’s not dive into the details of that today. For now, let’s just look at the cost of equity number for Canadian National Railway, which is 9.38%. Since Canadian National Railway’s return covers its cost in excess of 22.81%, its use of equity capital is efficient and likely to be sustainable. Simply put, Canadian National Railway pays less for its capital than what it generates in return. ROE can be broken down into three different ratios: net profit margin, asset turnover, and financial leverage. This is called the Dupont Formula:
Dupont Formula
ROE = profit margin × asset turnover × financial leverage
ROE = (annual net profit ÷ sales) × (sales ÷ assets) × (assets ÷ shareholders’ equity)
ROE = annual net profit ÷ shareholders’ equity
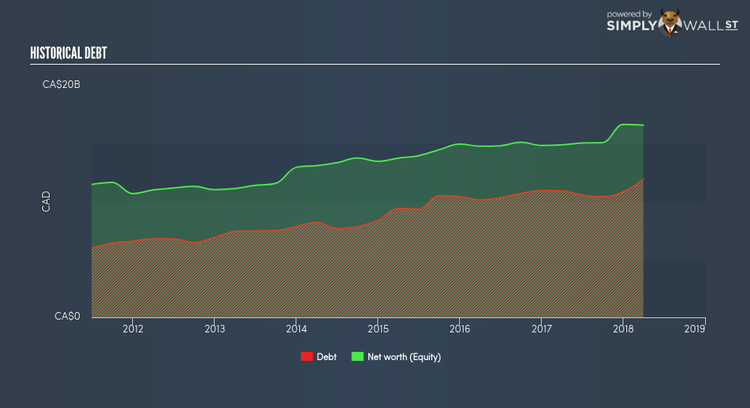
Essentially, profit margin shows how much money the company makes after paying for all its expenses. The other component, asset turnover, illustrates how much revenue Canadian National Railway can make from its asset base. The most interesting ratio, and reflective of sustainability of its ROE, is financial leverage. Since ROE can be inflated by excessive debt, we need to examine Canadian National Railway’s debt-to-equity level. The debt-to-equity ratio currently stands at a sensible 71.81%, meaning the above-average ROE is due to its capacity to produce profit growth without a huge debt burden.
Next Steps:
ROE is a simple yet informative ratio, illustrating the various components that each measure the quality of the overall stock. Canadian National Railway’s ROE is impressive relative to the industry average and also covers its cost of equity. ROE is not likely to be inflated by excessive debt funding, giving shareholders more conviction in the sustainability of high returns. ROE is a helpful signal, but it is definitely not sufficient on its own to make an investment decision.
For Canadian National Railway, there are three relevant factors you should further examine:
Financial Health: Does it have a healthy balance sheet? Take a look at our free balance sheet analysis with six simple checks on key factors like leverage and risk.
Valuation: What is Canadian National Railway worth today? Is the stock undervalued, even when its growth outlook is factored into its intrinsic value? The intrinsic value infographic in our free research report helps visualize whether Canadian National Railway is currently mispriced by the market.
Other High-Growth Alternatives : Are there other high-growth stocks you could be holding instead of Canadian National Railway? Explore our interactive list of stocks with large growth potential to get an idea of what else is out there you may be missing!
To help readers see pass the short term volatility of the financial market, we aim to bring you a long-term focused research analysis purely driven by fundamental data. Note that our analysis does not factor in the latest price sensitive company announcements.
The author is an independent contributor and at the time of publication had no position in the stocks mentioned.
