How To Read Stock Charts: Understand the Basics

Investing novices might be intimidated at first by the charts that the pros use to get a picture of what’s going on in the stock market. If that’s the case, don’t worry. They’re not so complicated once you understand the basics.
Read: 3 Things You Must Do When Your Savings Reach $50,000
How To Read the Stock Market
Before jumping into reading stock charts, you should set yourself up for success by laying the groundwork.
Pick a Platform
Stock charts all have the same basic fundamental components, but they each have a different look and feel. You’ll want to find a platform you like and stick with it.
Google Finance and Yahoo Finance are good places to start. They’re widely used, they have clean, user-friendly interfaces and they’re accurately updated in real time.
As a note, the images used in the tutorial below come from Google Finance. The charts for Amazon stock are from before the 20-to-1 stock split in June 2022. The prices shown have not been adjusted to account for the split.
Use Ticker Symbols To Search For Stock Charts
A ticker symbol is a one-to-five-letter code used to identify a company. They’re often, but not always, phonetically representative of the company’s name. Amazon’s ticker symbol, for example, is AMZN. That’s the stock and ticker symbol cited in all of the following graph examples. You can see the ticker symbol in the top right.
How To Read a Stock Chart
At this point, you’ve chosen a platform — Google Finance, for this example — and pulled up a stock — Amazon — by searching its ticker symbol, AMZN. Now, you see a bunch of colored lines and numbers. You may wonder, “How do you analyze a stock chart?” Here are some key takeaways on how to make those colored lines and numbers tell you what’s going on with a stock you’re interested in.

1. Choose a Time Frame
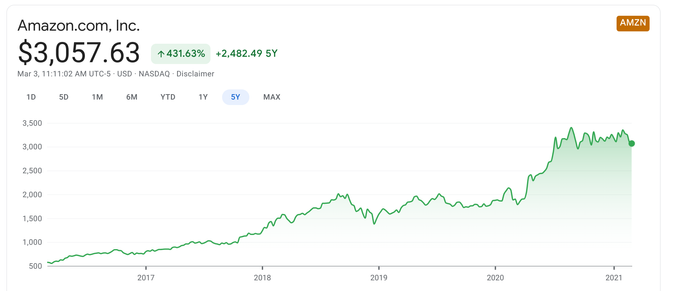
In the first example, you’ll see five years’ worth of Amazon stock history starting in 2016 through early 2021. The timeline progresses horizontally from left to right in chronological order at the bottom of the chart.
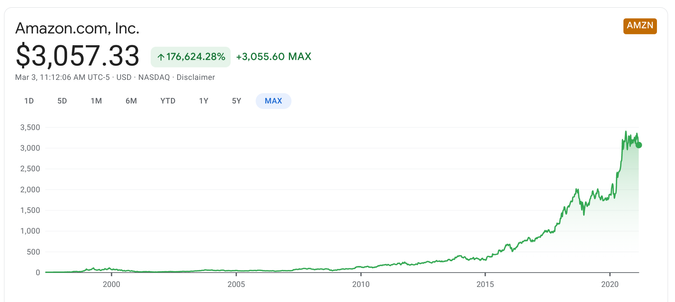
In the second example, you can see the stock’s entire history. Just click “max” instead of “5Y” for that perspective. The other options are:
1D: One day
5D: Five days
1M: One month
6M: Six months
YTD: Year to date
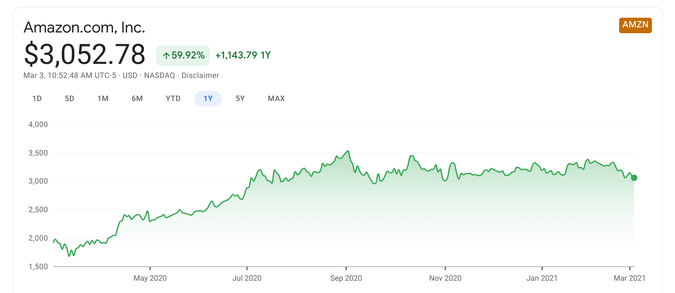
1Y: One year
5Y: Five years
Max: Total history
2. Spot the Trend
The dark green line that separates the shaded green area below and the white area above is called the trend line. The timeline is horizontal on the bottom of the chart. Running vertically on the left is the stock’s price in dollars. The trend line shows how the stock price changed over time.
In the case of Amazon, you can see that the stock price soared briefly in the late-1990s until the tech bubble burst. Then it hugged the floor well below $100 for several years before finally starting to get some air in the mid-2000s and then skyrocketing vertically to become one of the most valuable stocks in the world in the 2010s.
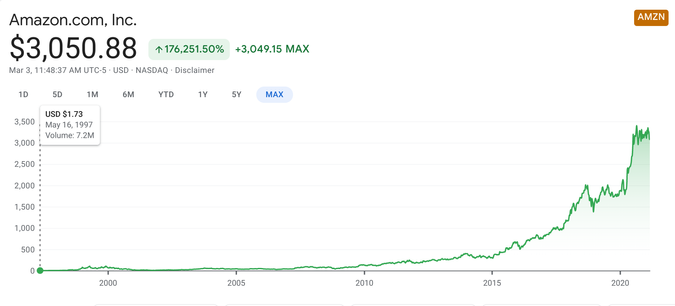
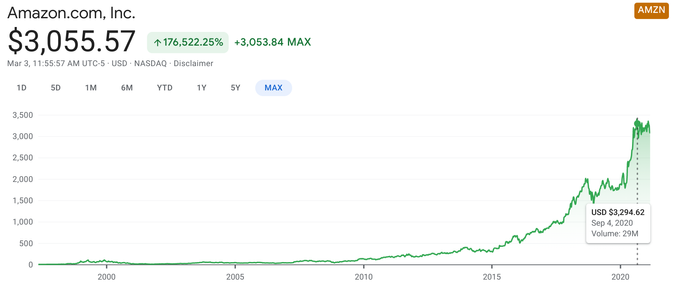
There will always be ups and downs, they can be frequent and drastic, but what’s important is that over time, the trend line moves in the desired direction — up and to the right. If you want to see where a stock’s price was at a specific point in time, just move your cursor over any point on the trend line like in the three examples shown here.
You can see exactly how many millions you missed out on by not buying up Amazon stock in 1997 and holding it forever. But now that you can read trend lines, you might just catch the next Amazon on its way up.
3. Lines of Resistance and Support Show Trends Within the Trend
As previously stated, trend lines follow price points in a jagged line that reveals the peaks and valleys that emerge along the way. Some of those peaks and valleys are called lines of support and lines of resistance, and investors use them as indicators of when to buy and when to sell.
The ability to spot them is one of the most important technical analysis skills you can learn.
Lines of resistance are the peaks at top of trendlines. They represent the highest point an investor believes the stock will climb before falling. That’s when it’s time to sell.
Lines of support are the valleys down below. These dips represent the low point that the investor thinks is the farthest the stock can fall before it starts to rise again. Those tell you when it’s time to buy.
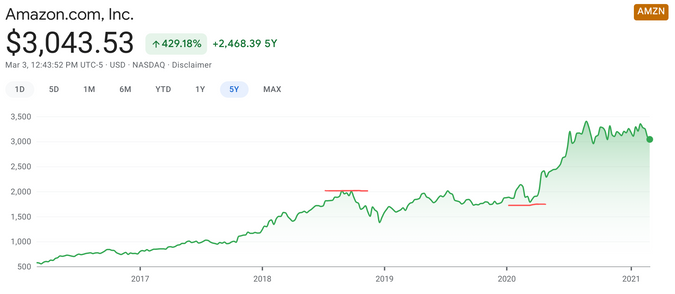
In this example, you can see that AMZN had a hard time breaching $2,000 in August-September 2018 — a wise time to sell if you can spot the resistance line. Then, in March 2020, AMZN appears to have bottomed out — the perfect time to buy.
As with anything, hindsight is incredibly helpful here. Lines of support and resistance are easy to spot after they’ve already been established. Trying to spot them in real time, not so much.
Experienced investors can make impressively accurate educated guesses, but they are guesses. If anyone had a formula that could be repeated with precision, they would buy at the bottom and sell at the top with every trade and become the world’s first trillionaire not long after.
4. Trading Volume
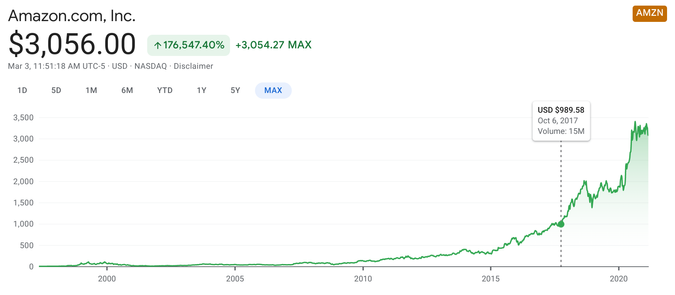
As you can see when placing your cursor on the trend line, in addition to showing that day’s price, the information box also includes a statistic for “volume.” On Oct. 6, 2017, the volume was 15 million.
Google Finance makes you use the cursor to reveal volume. On Yahoo Finance and many other platforms, stock charts use small vertical lines near the chronological timeline at the bottom of the chart to represent volume.
Either way, volume is something to consider, but it shouldn’t be the deciding factor for any action you take. It simply shows the level of trading activity associated with a given stock during a given time period. When volume is high, lots of people are buying and selling. This is important to investors because dramatic fluctuations in volume often — but certainly not always — coincide with equally dramatic price changes.
Tools of the Trade
Although you’ll want to pick a platform to research stocks and learn how to read stock charts, once you’ve learned, you’ll be able to read them all, the same way you can jump on any bike and pedal away the moment you learn how to ride your own.
At some point, you’ll need to open an investment account with a brokerage firm that uses its own charts so you can buy and sell stocks. The following are among the best commission-free brokerage firms:
In Conclusion
Stock charts let you isolate a specific stock, a fund or an entire index to see whether it’s going up or down over time. Within the trend line, you’ll see peaks and valleys that represent price swings. Sometimes, those price swings serve as a reliable buy and sell indicators called lines of support and resistance, which more advanced investors can identify in real time.
You can also gather information on trading volume to get the most out of your analysis. That’s all charts are — there is no magic, and charts don’t “tell” you anything. They present data in visual form. It’s up to you to learn how to identify and interpret that data for yourself. Successful investors first invest the time it takes to learn the basics.
FAQ
Here are the answers to some of the most frequently asked questions about reading stock charts.
How do you read stock trends?
The trend line shows peaks and valleys, which represent price swings. Some of these are called lines of support and lines of resistance and investors may use them as indicators of when to buy and sell.
How do you read stock tickers?
A ticker symbol is a code used to identify a company. Sometimes they are phonetically representative of the company’s name. Apple’s ticker symbol, for example, is AAPL.
Barbara Friedberg, Daria Uhlig and Valerie Ashton contributed to the reporting for this article.
This article originally appeared on GOBankingRates.com: How To Read Stock Charts: Understand the Basics
