The Poorest Big City in Every State
Media outlets often publish articles about the richest cities in each state, showing off the location’s biggest tourist attractions, fanciest neighborhoods or most sparkling amenities, like community theaters, parks and schools.
Learn More: 5 Things the Middle Class Can’t Afford Anymore
Find Out: Pocket an Extra $400 a Month With This Simple Hack
It isn’t as often that we hear about the regions in a state where residents struggle economically compared to a neighboring community or even live below the poverty level, but each state has at least one.
To determine the poorest big city in every state, GOBankingRates analyzed data about the median household income, the percentage of the population living below the poverty level and the per capita income, as sourced from the U.S. Census Bureau’s American Community Survey.
Read through to see what qualifies as the poorest city in your state and the rest of the United States.
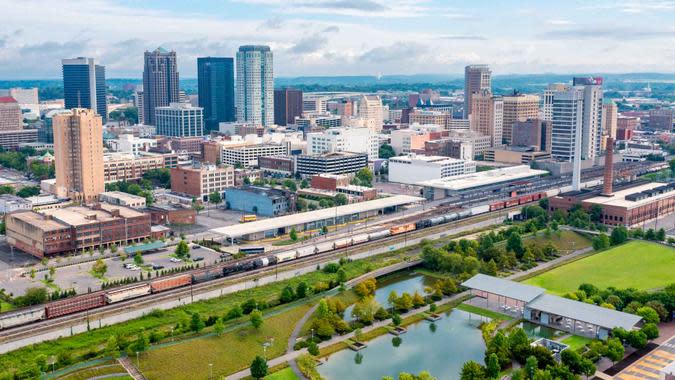
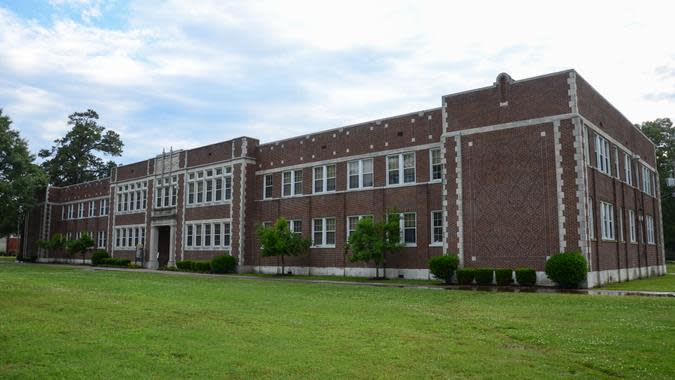
Birmingham, Alabama
Population: 200,431
Median Household Income: $42,464
Percentage of Population Below Poverty Level: 26.09%
Per Capita Income: $29,289
Related: 7 Things the Upper Middle Class Can’t Afford Anymore
See: 5 Life-Improving Things You Can Afford Once You Reach Upper Middle Class
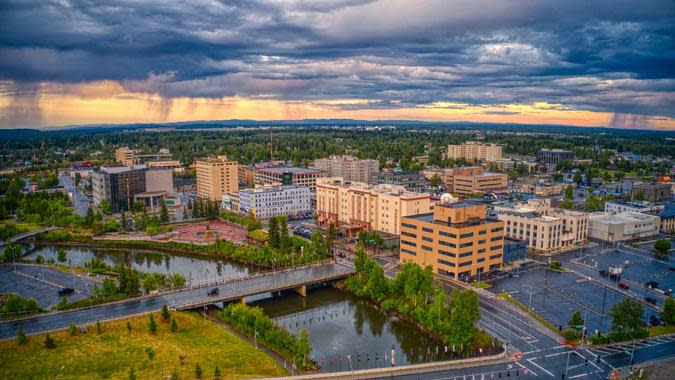
Fairbanks, Alaska
Population: 32,496
Median Household Income: $69,914
Percentage of Population Below Poverty Level: 9.67%
Per Capita Income: $34,820
Here: SNAP Benefit Maximums Have Increased — How Much More You’ll Receive Per Month in 2024
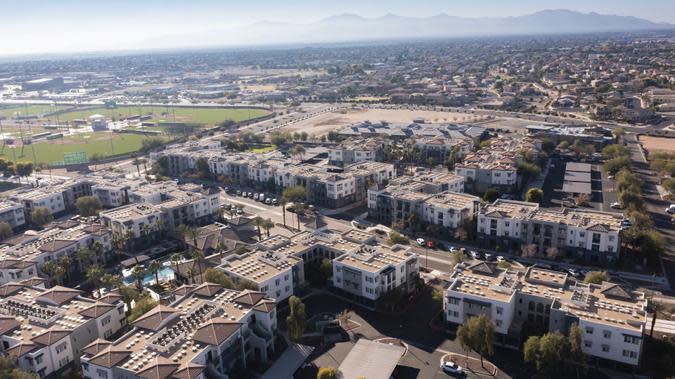
Surprise, Arizona
Population: 145,591
Median Household Income: $87,756
Percentage of Population Below Poverty Level: 6.79%
Per Capita Income: $37,518
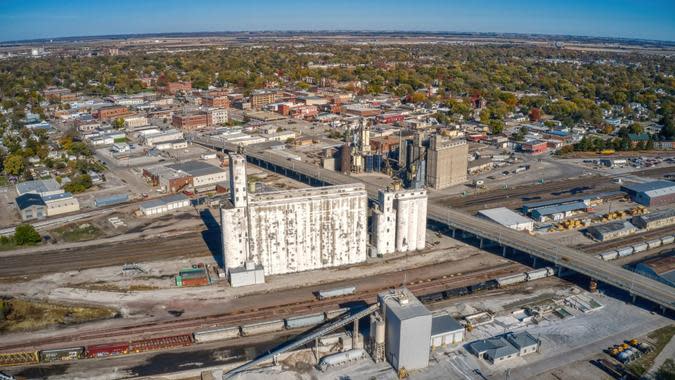
Pine Bluff, Arkansas
Population: 41,172
Median Household Income: $39,411
Percentage of Population Below Poverty Level: 24.88%
Per Capita Income: $21,170
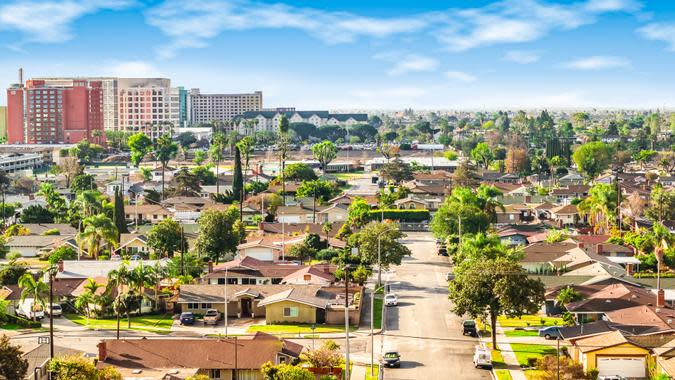
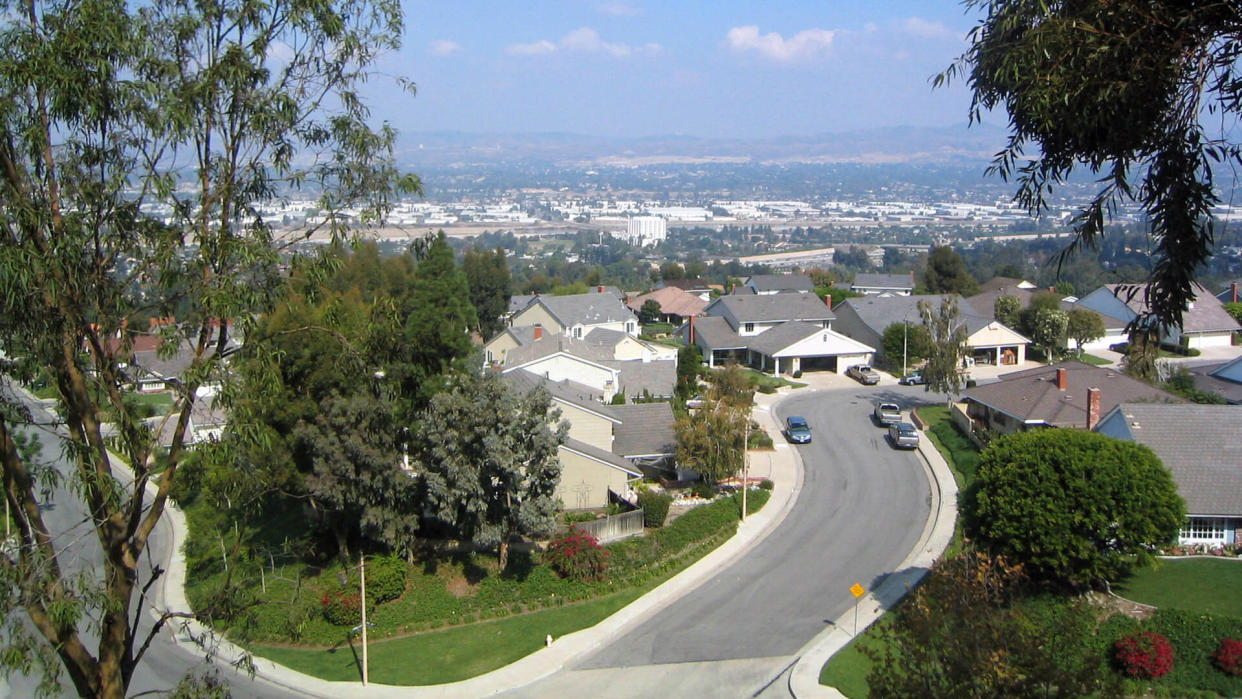
Anaheim, California
Population: 347,111
Median Household Income: $88,538
Percentage of Population Below Poverty Level: 12.62%
Per Capita Income: $35,331
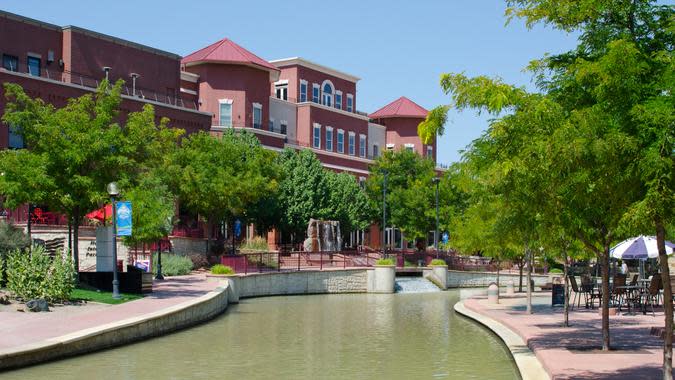
Pueblo, Colorado
Population: 111,430
Median Household Income: $52,794
Percentage of Population Below Poverty Level: 20.60%
Per Capita Income: $28,968
Food Stamps: 4 Major Changes to SNAP Coming in 2024
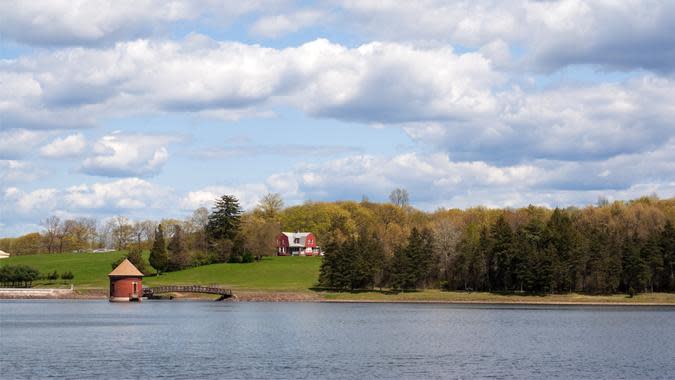
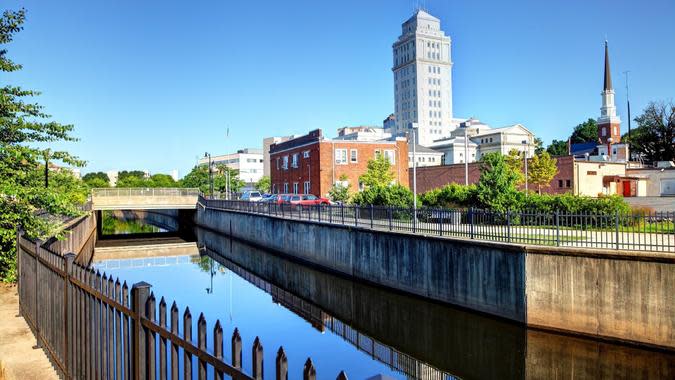
New Britain, Connecticut
Population: 74,212
Median Household Income: $53,766
Percentage of Population Below Poverty Level: 19.70%
Per Capita Income: $28,796
Smyrna, Delaware
Population: 12,870
Median Household Income: $68,260
Percentage of Population Below Poverty Level: 9.99%
Per Capita Income: $31,340
Hialeah, Florida
Population: 222,996
Median Household Income: $49,531
Percentage of Population Below Poverty Level: 17.81%
Per Capita Income: $24,295
South Fulton, Georgia
Population: 107,865
Median Household Income: $77,488
Percentage of Population Below Poverty Level: 9.37%
Per Capita Income: $36,153
See: Americans Are Struggling To Buy Groceries: Here’s How They’re Cutting Costs
Kahului, Hawaii
Population: 27,233
Median Household Income: $94,712
Percentage of Population Below Poverty Level: 8.72%
Per Capita Income: $34,885

Caldwell, Idaho
Population: 61,212
Median Household Income: $65,259
Percentage of Population Below Poverty Level: 12.63%
Per Capita Income: $24,112
Waukegan, Illinois
Population: 89,435
Median Household Income: $66,077
Percentage of Population Below Poverty Level: 15.00%
Per Capita Income: $30,089

Lafayette, Indiana
Population: 70,828
Median Household Income: $50,674
Percentage of Population Below Poverty Level: 16.47%
Per Capita Income: $29,523
Social Security Cuts: 5 Expenses Retirees Should Avoid Completely
Council Bluffs, Iowa
Population: 62,670
Median Household Income: $61,181
Percentage of Population Below Poverty Level: 13.59%
Per Capita Income: $31,946
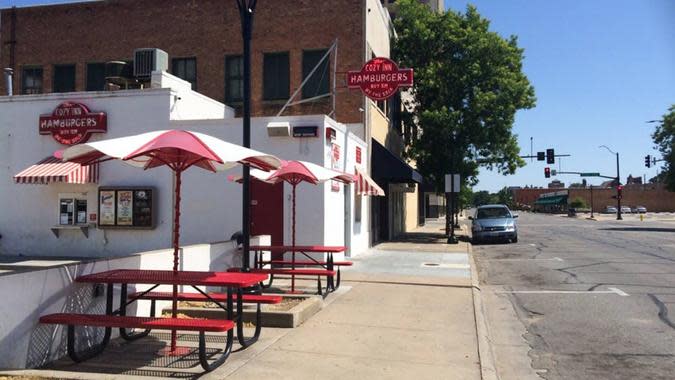
Salina, Kansas
Population: 46,734
Median Household Income: $56,945
Percentage of Population Below Poverty Level: 12.67%
Per Capita Income: $31,477

Richmond, Kentucky
Population: 34,883
Median Household Income: $45,457
Percentage of Population Below Poverty Level: 22.23%
Per Capita Income: $26,787

Bossier City, Louisiana
Population: 62,971
Median Household Income: $54,100
Percentage of Population Below Poverty Level: 20.36%
Per Capita Income: $30,737
Learn: 5 Frugal Habits That Rarely Pay Off for the Middle Class
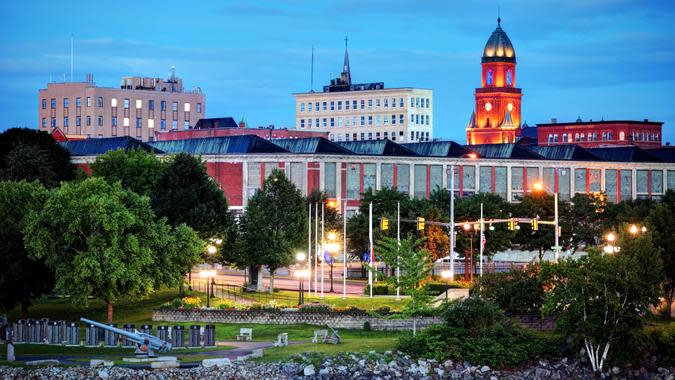
Lewiston, Maine
Population: 37,577
Median Household Income: $54,317
Percentage of Population Below Poverty Level: 17.83%
Per Capita Income: $29,223
Glen Burnie, Maryland
Population: 71,427
Median Household Income: $86,283
Percentage of Population Below Poverty Level: 8.16%
Per Capita Income: $41,570

Lynn, Massachusetts
Population: 100,653
Median Household Income: $70,046
Percentage of Population Below Poverty Level: 14.08%
Per Capita Income: $31,816

Warren, Michigan
Population: 138,588
Median Household Income: $61,633
Percentage of Population Below Poverty Level: 13.52%
Per Capita Income: $31,080
Similar: 10 Ways People Become Poor Even While Earning a High Salary for Years
Brooklyn Park, Minnesota
Population: 84,951
Median Household Income: $82,271
Percentage of Population Below Poverty Level: 8.88%
Per Capita Income: $36,531
Greenville, Mississippi
Population: 29,495
Median Household Income: $35,148
Percentage of Population Below Poverty Level: 32.20%
Per Capita Income: $22,111
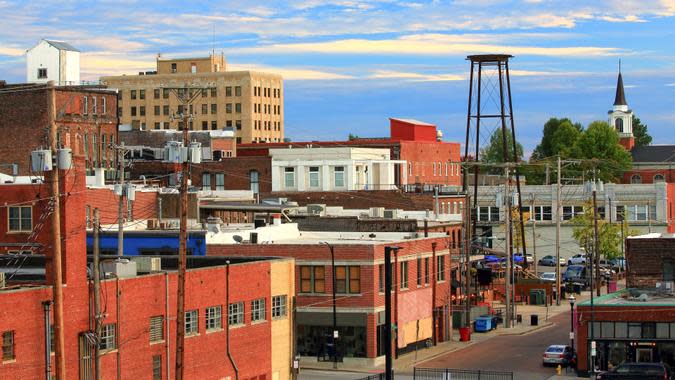
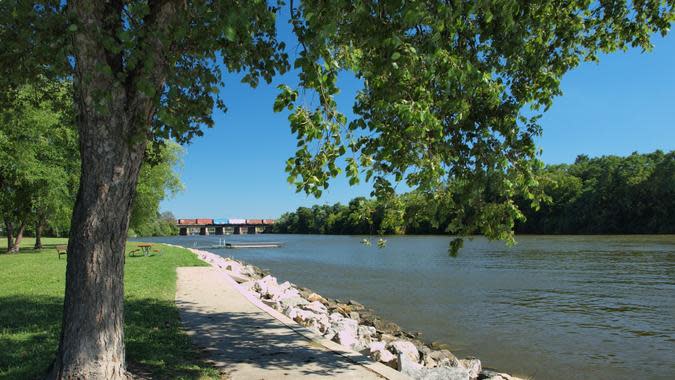
Springfield, Missouri
Population: 168,873
Median Household Income: $43,450
Percentage of Population Below Poverty Level: 20.32%
Per Capita Income: $28,806

Kalispell, Montana
Population: 25,473
Median Household Income: $57,123
Percentage of Population Below Poverty Level: 10.37%
Per Capita Income: $32,570
More: 6 Pennies from the 1900s Worth a Lot of Money
Fremont, Nebraska
Population: 27,230
Median Household Income: $62,226
Percentage of Population Below Poverty Level: 9.52%
Per Capita Income: $31,944

Sunrise Manor, Nevada
Population: 198,325
Median Household Income: $52,476
Percentage of Population Below Poverty Level: 21.82%
Per Capita Income: $22,600

Laconia, New Hampshire
Population: 16,898
Median Household Income: $67,856
Percentage of Population Below Poverty Level: 10.20%
Per Capita Income: $39,171
Elizabeth, New Jersey
Population: 135,665
Median Household Income: $59,939
Percentage of Population Below Poverty Level: 15.35%
Per Capita Income: $26,633
Save Here: 4 Bills You Don’t Have to Pay If You’re Poor
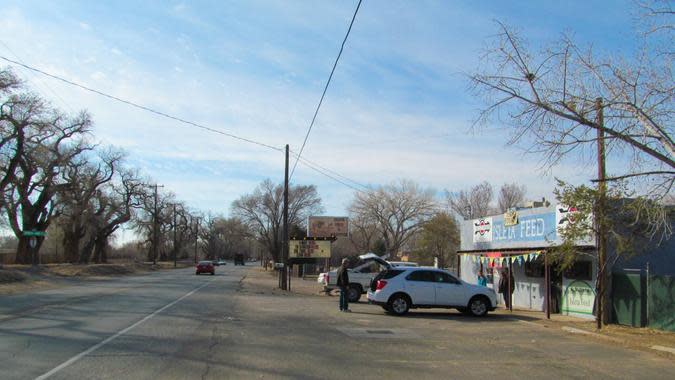
South Valley, New Mexico
Population: 37,601
Median Household Income: $44,670
Percentage of Population Below Poverty Level: 21.01%
Per Capita Income: $24,047

Cheektowaga, New York
Population: 76,483
Median Household Income: $64,066
Percentage of Population Below Poverty Level: 8.80%
Per Capita Income: $34,897

Concord, North Carolina
Population: 105,335
Median Household Income: $83,480
Percentage of Population Below Poverty Level: 7.52%
Per Capita Income: $39,148
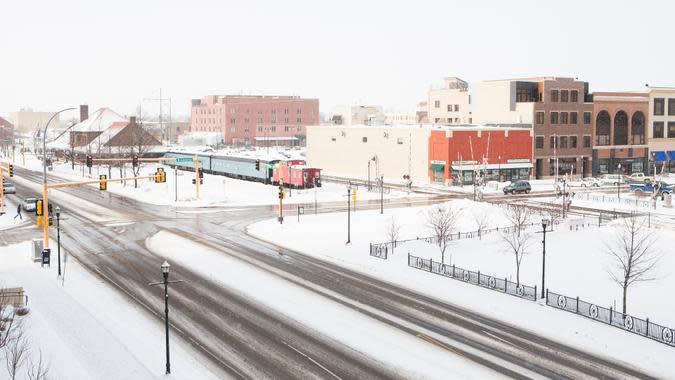
Jamestown, North Dakota
Population: 15,850
Median Household Income: $53,389
Percentage of Population Below Poverty Level: 14.89%
Per Capita Income: $34,078
More Here: 9 Frugal Habits Dave Ramsey Swears By
Canton, Ohio
Population: 70,589
Median Household Income: $37,627
Percentage of Population Below Poverty Level: 30.24%
Per Capita Income: $22,649

Lawton, Oklahoma
Population: 91,023
Median Household Income: $51,561
Percentage of Population Below Poverty Level: 19.40%
Per Capita Income: $27,221

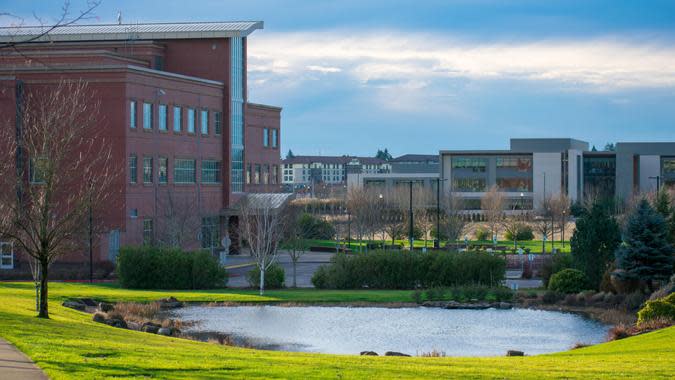
Springfield, Oregon
Population: 61,740
Median Household Income: $60,982
Percentage of Population Below Poverty Level: 16.41%
Per Capita Income: $29,284
Reading, Pennsylvania
Population: 94,601
Median Household Income: $42,852
Percentage of Population Below Poverty Level: 28.61%
Per Capita Income: $20,782
See: 6 Old-Fashioned Frugal Living Tips That Still Work (And Can Save You Big Money)
Central Falls, Rhode Island
Population: 22,359
Median Household Income: $43,092
Percentage of Population Below Poverty Level: 24.43%
Per Capita Income: $19,552

Sumter, South Carolina
Population: 43,046
Median Household Income: $48,900
Percentage of Population Below Poverty Level: 17.50%
Per Capita Income: $27,742
Huron, South Dakota
Population: 14,179
Median Household Income: $57,702
Percentage of Population Below Poverty Level: 11.08%
Per Capita Income: $29,576
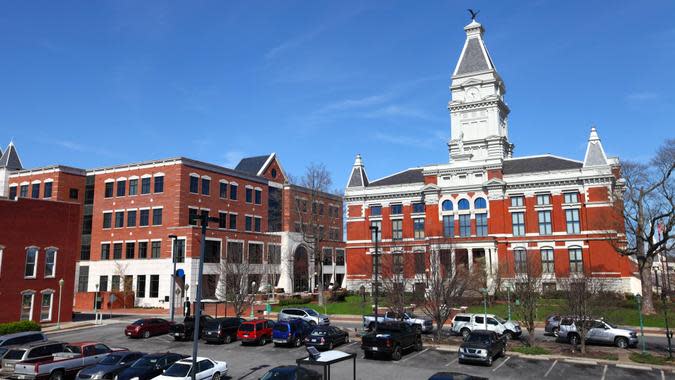
Clarksville, Tennessee
Population: 167,882
Median Household Income: $62,688
Percentage of Population Below Poverty Level: 12.88%
Per Capita Income: $29,481
Spot It: Buffalo Nickels Could Be Worth Thousands — How To Spot One
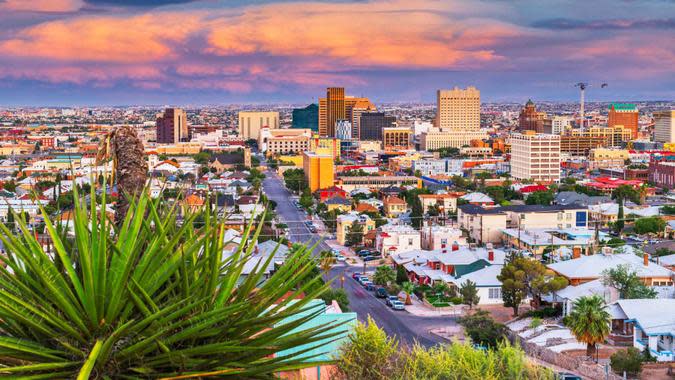
El Paso, Texas
Population: 677,181
Median Household Income: $55,710
Percentage of Population Below Poverty Level: 18.94%
Per Capita Income: $27,434
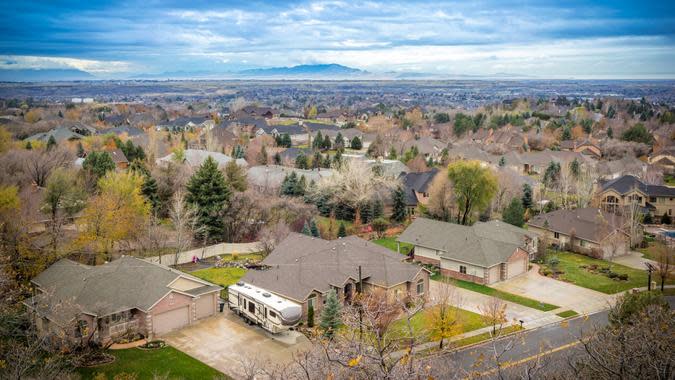
Ogden, Utah
Population: 86,754
Median Household Income: $66,226
Percentage of Population Below Poverty Level: 12.12%
Per Capita Income: $31,437
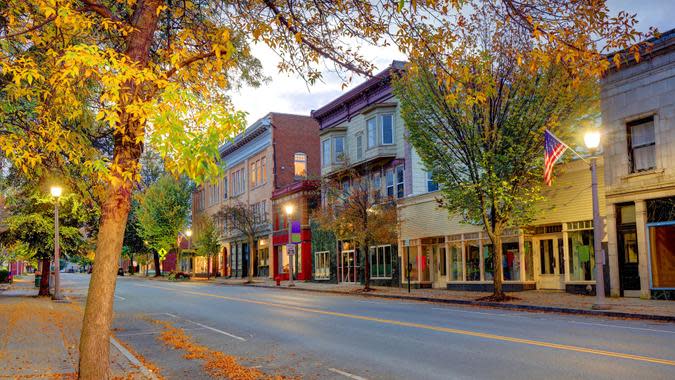
Bennington, Vermont
Population: 8,753
Median Household Income: $51,221
Percentage of Population Below Poverty Level: 14.96%
Per Capita Income: $33,141
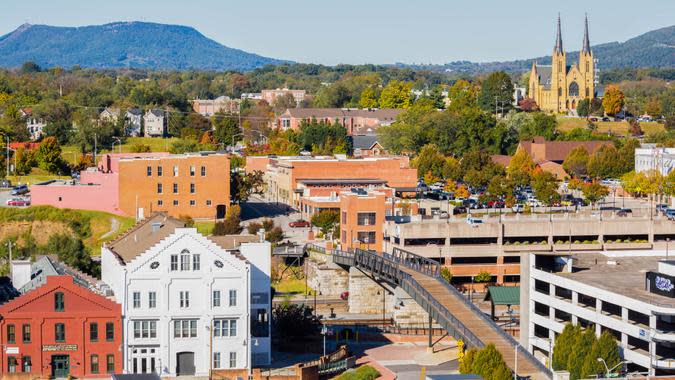
Roanoke, Virginia
Population: 99,213
Median Household Income: $51,523
Percentage of Population Below Poverty Level: 19.11%
Per Capita Income: $33,206
Find Out: You Can Get These 3 Debts Canceled Forever
Vancouver, Washington
Population: 190,700
Median Household Income: $73,626
Percentage of Population Below Poverty Level: 12.33%
Per Capita Income: $40,219
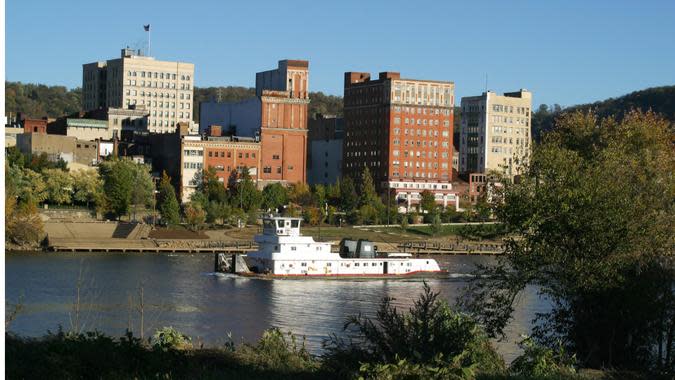
Wheeling, West Virginia
Population: 26,900
Median Household Income: $46,516
Percentage of Population Below Poverty Level: 18.25%
Per Capita Income: $33,868
Janesville, Wisconsin
Population: 65,669
Median Household Income: $68,610
Percentage of Population Below Poverty Level: 9.87%
Per Capita Income: $35,135
Riverton, Wyoming
Population: 10,733
Median Household Income: $50,861
Percentage of Population Below Poverty Level: 14.48%
Per Capita Income: $25,653
Methodology: To find the poorest big cities in every state, GOBankingRates analyzed the top 10 cities in each state by population, as sourced from the U.S. Census American Community Survey. For each city, the median household income, the percentage of population below the poverty level and the per capita income also were sourced from the American Community Survey. The median household income, per capita income and percentage of population below poverty level were all scored and summed to allow a comparison of each city within every state. The cities with higher scores represent poorer cities with lower median household incomes, higher poverty rates and lower per capita income. The highest-scoring city in each state was determined to be its poorest big city. All data was collected and is up to date as of Dec. 12, 2023.
This article originally appeared on GOBankingRates.com: The Poorest Big City in Every State
