Facebook Quarterly Earnings: By the Numbers


Facebook (FB) doubled its profit to $802 million in the third quarter, while revenue rose 59 percent to $3.2 billion, on persistent gains in mobile advertising. But expenses from acquisitions took their toll on results, as Facebook bought messaging app WhatsApp and Occulus during the quarter. Facebook's stock tumbled almost 10 percent after its earnings were announced, as CFO David Wehner warned Wall Street about continued higher expenses from future investments in companies and talent.
The tumble came despite a stellar performance in advertising sales. Facebook's advertising revenue jumped by 64 percent in the third quarter, with a big boost from mobile advertising-the key trend of the future-- which accounted for 66 percent of its ad revenue, up from 62 percent in the second quarter and 59 percent in the first quarter of 2014. Additionally, Facebook has only just begun to sell ads on Instagram, the photo-sharing company it bought in 2012 for $1 billion, while it has not even begun to monetize WhatsApp amidst high future expectations by many investors.
User growth was impressive, especially compared to user metrics from rival Twitter (TWTR), which reported earnings Monday. Facebook's daily active users rose by 35 million or 4.2 percent from the second quarter. That translates into a whopping 64 percent of Facebook users logging in daily, a percent that keeps rising.
This earnings release follows the earnings announcements from the following peers of Facebook: Google (GOOG), Twitter and Yahoo! (YHOO).
Highlights
Summary numbers: Revenues of $3.2 billion, Net Earnings of $802 million and Earnings per Share (EPS) of $0.30.
Performance focus on earnings: change in earnings of 90.1 percent compared to same period last year; better than change in revenues of 58.9 percent
Gross margins now 90.4 percent from 88.7 percent compared to the same period last year, operating (EBITDA) margins now 52.6 percent from 52.2 percent
Earnings potentially benefiting from some unlocking of (accounting) accruals: change in operating cash flow of 31.37 percent trailed change in earnings.
The table below shows the preliminary results and recent trends for key metrics such as revenues and net income (See complete table at the end of this report):
Q3 2013 | Q4 2013 | Q1 2014 | Q2 2014 | Q3 2014 | |
Revenue Growth (YOY) | 59.7% | 63.1% | 71.6% | 60.5% | 58.9% |
Earnings Growth (YOY) | 815.3% | 1109.3% | 194.5% | 138.1% | 90.0% |
Net Margin | 20.9% | 20.1% | 25.5% | 27.1% | 25.0% |
EPS | $0.17 | $0.20 | $0.25 | $0.30 | $0.30 |
Return on Equity | 13.3% | 14.6% | 15.9% | 18.0% | 16.2% |
Return on Assets | 11.0% | 12.7% | 13.8% | 15.8% | 14.3% |
Market Share Versus Profits
Comparing revenue growth to earnings growth helps Capital Cube evaluate whether a company's strategy is to focus more on growing market share at the expense of earnings.


Facebook's performance this quarter suggests a focus on boosting the bottom-line earnings. Facebook's increase in revenue compared to the same period last year of 58.9 percent trailed its improvement in earnings, which rose 90.0 percent. While the revenue performance could be higher, it is important to note that this increase in revenues is among the highest in the peer group announcing thus far. Also, for comparison purposes, revenues rose 10.1 percent and earnings rose 1.8 percent compared to the quarter ending June 30, 2014.

Earnings Growth Analysis
The company's earnings growth has been influenced by the following factors: (1) Improvements in gross margins from 88.7 percent to 90.4 percent compared to a year ago and (2) better cost controls. As a result, operating margins (EBITDA margins) improved from 52.2 percent to 52.6 percent compared to a year ago. (Gross margins were 92.6 percent and operating-EBITDA margins 56.6 percent in the immediate last quarter.)

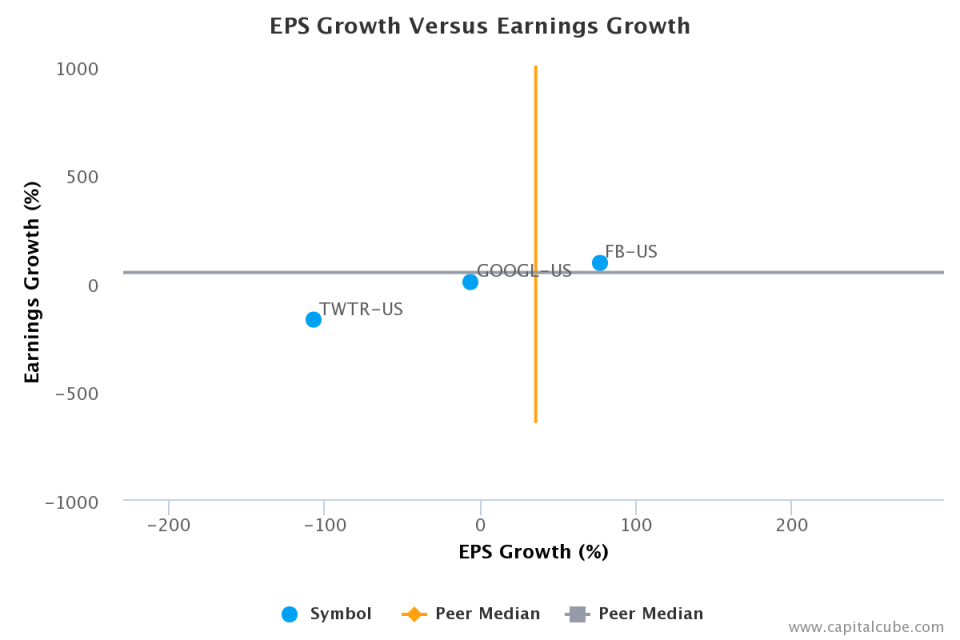
EPS Growth Versus Earnings Growth
Facebook's increase in Earnings per Share (EPS) of 76.5 percent is less than its rise in earnings of 90.1 percent. The change in earnings is less than the average among the results announced by its peer group, suggesting that, despite its strong earnings performance, the company may be losing ground in generating profits in this group.

Margins
The company's earnings growth has also been influenced by the following factors: (1) Improvements in operating (EBITDA) margins from 38.6 percent to 43.6 percent and (2) one-time accounting items. The company's pretax margins widened to 41.7 percent compared to 36.0 percent for the same period last year.

Cash Versus Earnings
Investors have to judge whether Facebook's performance is sustainable by looking beyond the earnings numbers, as companies often post earnings numbers that are influenced by non-cash activities. Capital Cube evaluates the quality of the announced earnings numbers by examining the deviation in the earnings growth rate from the growth in operating cash flows. In general, an earnings growth rate that is higher than operating cash flow growth implies a higher proportion of non-operating and even one-time activities--activities that are typically not sustainable over long periods.

Facebook's change in operating cash flow of 31.4 percent trailed its change in earnings, suggesting that the earnings number might have benefited from its accounting treatment -- some unlocking of accruals. On a positive note, this change in operating cash flow was better than the average among the announced results thus far in its peer group.

Supporting Data
The table below shows the preliminary results along with the recent trend for revenues, net income and other relevant metrics:
Q3 2013 | Q4 2013 | Q1 2014 | Q2 2014 | Q3 2014 | |
Revenue Growth (YOY) | 59.7% | 63.1% | 71.6% | 60.5% | 58.9% |
Peer Average Revenue Growth (YOY) | 32.8% | 40.9% | 41.1% | 36.9% | 35.0% |
Earnings Growth (YOY) | 815.3% | 1109.3% | 194.5% | 138.1% | 90.0% |
Peer Average Earnings Growth (YOY) | -27.4% | 22.1% | -5.2% | 9.0% | 45.8% |
Gross Margin | 88.7% | 87.9% | 92.1% | 92.6% | 90.4% |
Peer Average Gross Margin | 81.9% | 75.5% | 82.6% | 82.8% | 83.0% |
EBITDA Margin | 52.2% | 54.8% | 53.5% | 56.6% | 52.6% |
Peer Average EBITDA Margin | 25.8% | 26.9% | 25.5% | 24.8% | 24.6% |
Net Margin | 20.9% | 20.1% | 25.5% | 27.1% | 25.0% |
Peer Average Net Margin | 20.4% | 20.1% | 24.6% | 23.4% | 21.6% |
EPS | $0.17 | $0.20 | $0.25 | $0.30 | $0.30 |
Peer Average EPS | $0.23 | $0.27 | $0.27 | $0.28 | $2.20 |
Return on Equity | 13.3% | 14.6% | 15.9% | 18.0% | 16.2% |
Peer Average Return on Equity | 11.1% | 12.7% | 12.7% | 11.6% | 14.3% |
Return on Assets | 11.0% | 12.7% | 13.8% | 15.8% | 14.3% |
Peer Average Return on Assets | 9.3% | 10.7% | 10.2% | 9.1% | 12.0% |
Company Profile
Facebook, Inc. is a social networking service and website. It aims to make the world more open and connected. People use Facebook to stay connected with their friends and family, to discover what is going on in the world around them, and to share and express what matters to them to the people they care about. The company offers advertisers a unique combination of reach, relevance, social context, and engagement to enhance the value of their ads. Its services include timeline, news feed, messages, lists, ticker and mobile apps. Facebook was founded by Mark Elliot Zuckerberg, Dustin Moskovitz, Chris R. Hughes and Eduardo Saverin on February 4, 2004 and is headquartered in Menlo Park, CA.
CapitalCube does not own any shares in the stocks mentioned and focuses solely on providing unique fundamental research and analysis on approximately 50,000 stocks and ETFs globally. Try any of our analysis, screener or portfolio premium services free for 7 days. To get a quick preview of our services, check out our free quick summary analysis of FB.
