Realized Cap Increase Suggests BTC Still in Bullish Trend: On-Chain Analysis
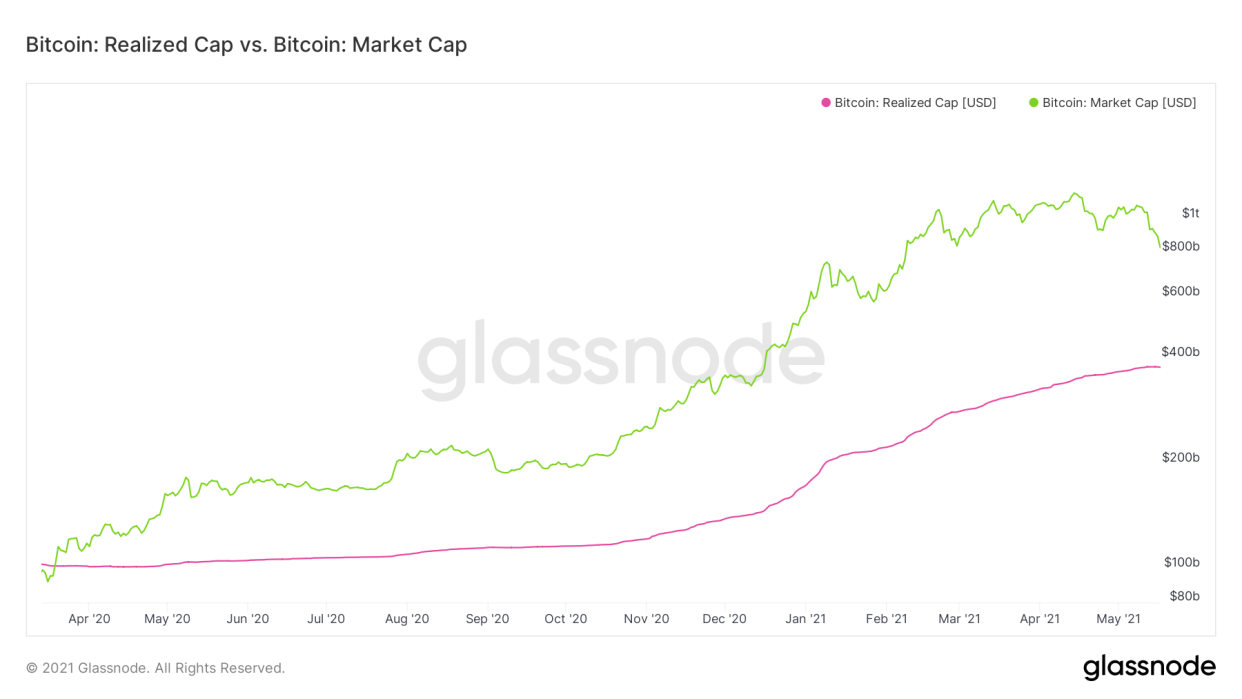
The realized cap for bitcoin (BTC) has been moving upwards at an accelerated rate since the beginning of the year.
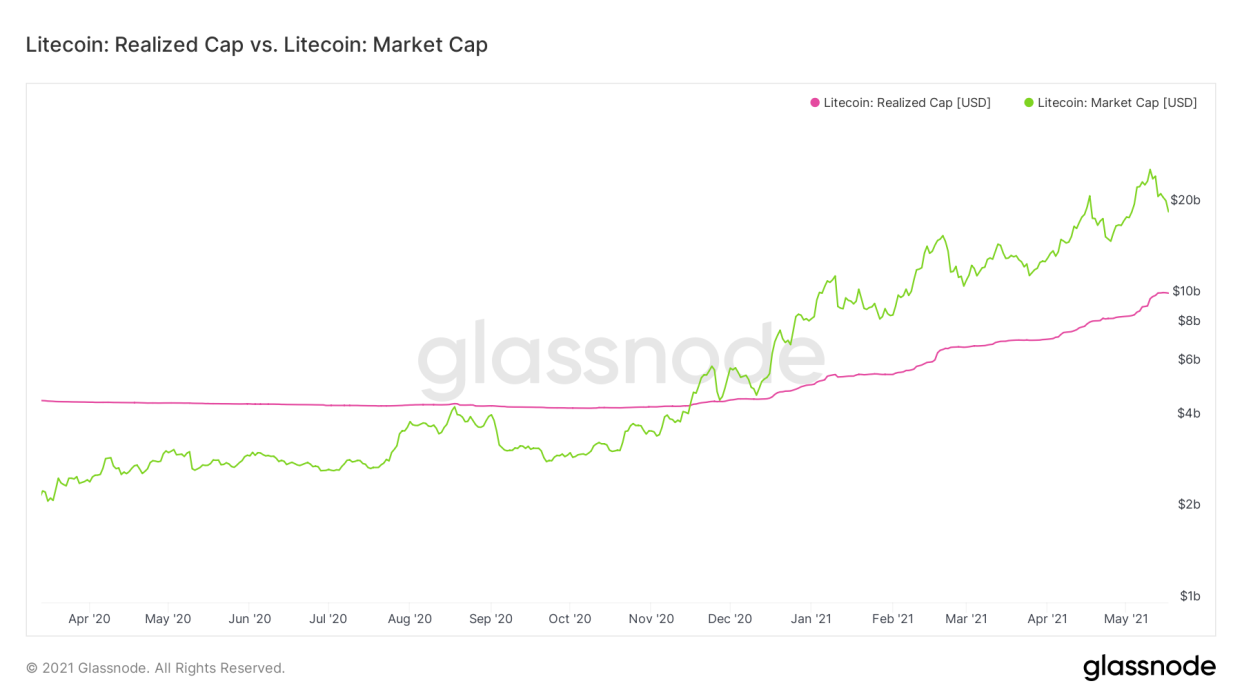
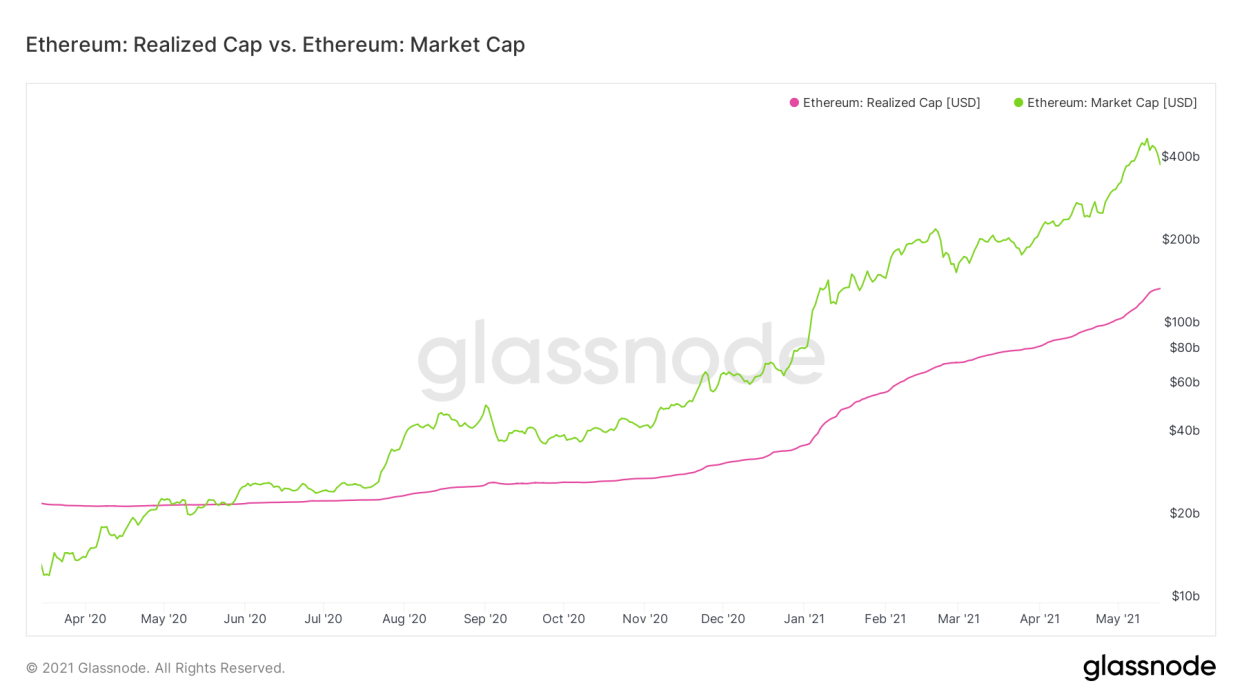
This is a sign of a bullish trend, and is also present in both ethereum (ETH) and litecoin (LTC).
Market and realized cap
The market cap (MC) is created by multiplying the current BTC price with the number of coins that have been mined so far.
The realized cap (RC) is created in a similar way. However, the difference is that instead of taking the current price, it measures the price at the time when the most recent Unspent Transaction Output (UTXO) was last moved.
As a result, instead of representing the market value, it represents the realized value of the blockchain. This is done in order to reduce the importance of coins that have not moved for a long period of time and coins that are lost.
If those coins are spent after a long period of time in dormancy, it would likely result in a significant increase in the realized market cap, since they would be repriced based on the price recorded the last time they moved.
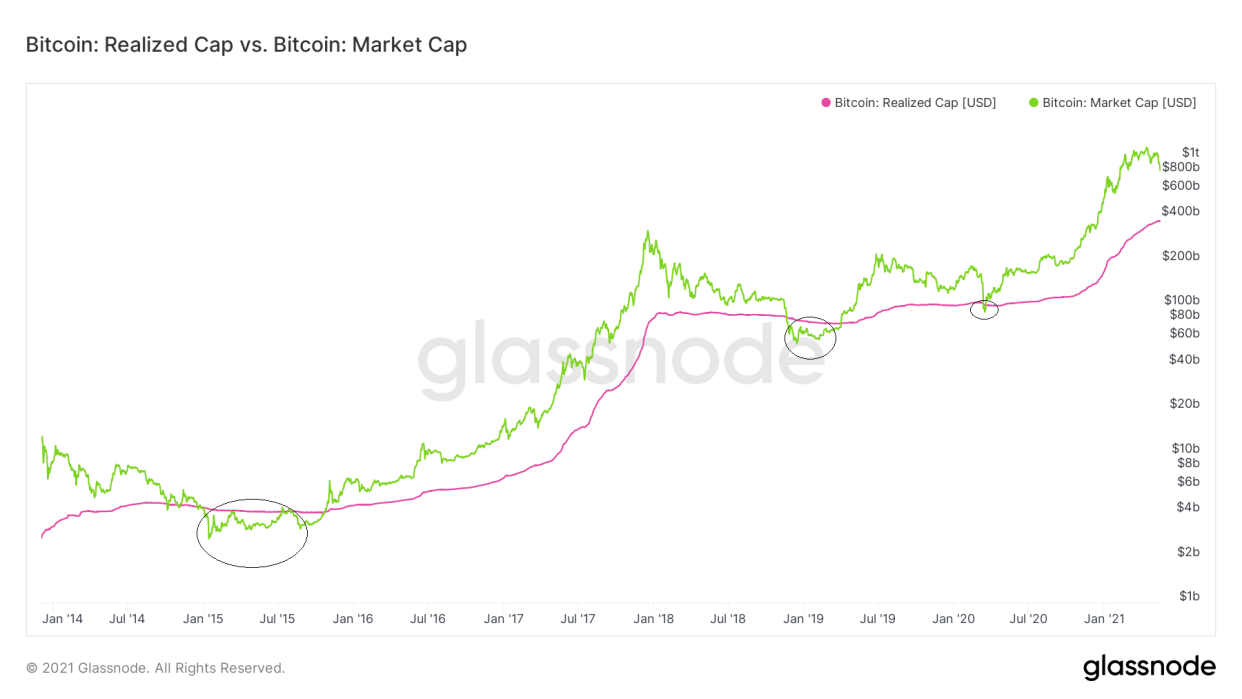
Realized and market cap for bitcoin
The market and realized caps can be paired in order to determine whether the market is in a state of aggregate profit or loss.
If MC is trading above RC, the market is in profit.
If MC is trading below RC, the market is in loss.
The market cap traded below the realized only three times in the price history of BTC. These periods are circled in black in the image below. They occurred in March 2015, December 2018, and March 2020.
All three marked cyclical bottoms.
There are several characteristics of the realized cap during bull and bear markets.
In bull markets, it increases at a very steep rate. This occurs because coins that previously had not moved for a significant period of time are spent in order to realize profits.
In bear markets, the cap decreases, since market participants sell at a loss.
Finally, it moves sideways during periods of accumulations, since the majority of coins are moved into cold storage wallets.
RC has been increasing since March 2020. However, it has been doing so at an accelerated rate since December 2020. It is interesting to note that this is occurring, despite a decrease in market cap that has been going on for the past month.
As outlined above, this is a characteristic of bull markets.
Litecoin
A similar occurrence is visible in LTC. However, its market cap was below realized cap until November 2020. This period is likely to have marked the price bottom.
Since then, both have been trending upwards, with the latter moving at a more accelerated rate.
Ethereum
The same comparison for ETH is closer to that of BTC than that of LTC. The market cap moved above realized cap in May 2020, confirming the end to the bearish market.
Both have been moving upwards since.
For BeInCrypto’s latest bitcoin (BTC) analysis, click here.
