How Are Lottery Winnings Taxed in Your State?

The lottery is a thrilling game of chance. Checking your numbers after a big drawing to see if your ticket will lead to grander daydreams is all part of the fun. If you do find yourself holding the winning lottery ticket just remember: Uncle Sam and potentially your city and state will take a portion of the winnings.
So, how much are lottery winnings taxed, anyway? Our guide about lottery wins and taxes will give you an idea.*
Take note! We are not tax experts. For the official word on lottery winnings and your federal and state taxes, double check the gambling income rules laid out at IRS.gov, your state taxing authority and contact a CPA or tax attorney.
Lottery and Federal Taxes
Right off the bat, expect the federal government to take at least 24% of winnings over $5,000 upfront. Why? Lottery winnings are considered taxable income. Besides the upfront withholding, your total federal tax rate could be higher—up to 37%. If you win a big prize, for example, it’s very likely you’ll be pushed into a higher tax bracket when adding your lottery winnings to your regular income.
Let’s take a look at those tax brackets:
Related: How to Split Lottery Winnings with Family or Co-Workers
Tax brackets 2023 for taxes filed in 2024
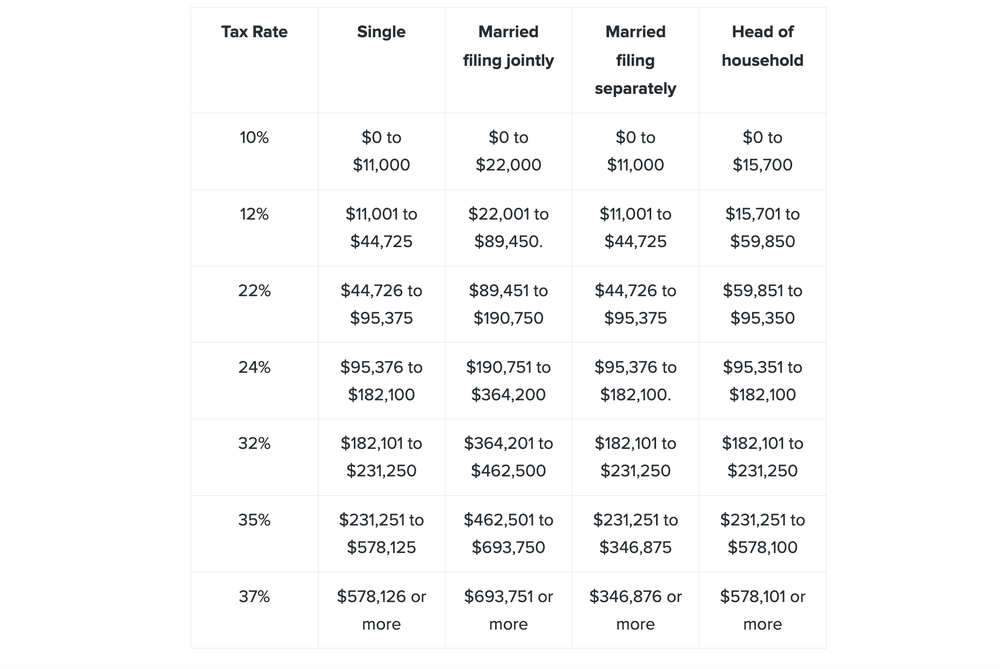
If you make $35,000 in 2023 and win $100,000 in the lottery, your marginal tax rate jumps two tax brackets from 12% to 24%. We won’t get into specific numbers as we are not tax advisors, but you get the idea about how winning the lottery can affect your income and how it can potentially affect you.
Who else wants a piece? Your state may take its fair share, too.
Lottery and State Taxes
We’ve discussed what portion of your lottery winnings will go to taxes at the federal level, but how much are lottery winnings taxed at the state level? We wish there was a simple answer to this question, but in reality, it depends. The tax rate on lottery winnings varies by state.
Of states that participate in the lottery, there are nine states where lottery winnings and taxes do not go hand in hand. Count yourself lucky if you live in one of these states:
California
Florida
New Hampshire
South Dakota
Tennessee
Texas
Washington
Wyoming
Texas, Washington and Florida all do not have state income tax, so there are no lottery state taxes here either. These states will not levy additional taxes on your lottery winnings. Let's take a look at the best and the worst states to win the lottery based on tax rates.
Best states for lottery wins and taxes
These states do have lottery state taxes but offer the lowest tax rates.
North Dakota - Tax rate 2.9%
Mississippi - Tax rate 3.0%
Pennsylvania - Tax rate 3.07%
Indiana - Tax rate 3.23%
Colorado, Missouri, Ohio, Virginia - Tax rate 4.0%
Check your state lottery website for the most up-to-date tax information for where you live.
Worst states for lottery wins and taxes
These states will charge the highest percentage for lottery state taxes.
New York - 10.9%
Maryland - 8.75%
Washington DC - 8.5%
Oregon, New Jersey - 8.0%
Wisconsin - 7.65%
Check your state lottery website for the most up-to-date tax information for where you live.
All States
In alphabetical order, here are the tax rates on lottery winnings for all states with a lottery:
Arizona - 4.8%
Arkansas - 4.4%
California - no state taxes for lottery prizes
Colorado - 4.0%
Connecticut - 6.99%
Delaware - All winning Delaware Lottery tickets are subject to Delaware Income Tax.
Florida - no state taxes for lottery prizes
Georgia - 5.49%
Idaho - 6.93%
Illinois - 4.95%
Indiana - 3.23%
Iowa - 5.0%
Kansas - 5.0%
Kentucky - 6.0%
Louisiana - 4.25%
Maine - 7.15%
Maryland - 8.75%
Massachusetts - 5.0%
Michigan - 4.25%
Minnesota - 7.25%
Mississippi - 3.0%
Missouri - 4.0%
Montana - 6.9%
Nebraska - 5.0%
New Hampshire - No state taxes for lottery prizes
New Jersey - 8.0%
New Mexico - 6.0%
New York - 10.9%
North Carolina - 4.75%
North Dakota - 2.9%
Ohio - 4.0%
Oklahoma - 4.75%
Oregon - 8.0%
Pennsylvania - 3.07%
Rhode Island - 5.99%
South Carolina - 7.0%
South Dakota - no state taxes for lottery prizes
Tennessee - no state taxes for lottery prizes
Texas - no state taxes for lottery prizes
Vermont - 6.0%
Virginia - 4.0%
Washington - no state taxes for lottery prizes
Washington, DC - 8.50%
West Virginia - 6.50%
Wisconsin - 7.65%
Wyoming - no state taxes for lottery prizes
Check your state lottery website for the most up-to-date tax information for where you live.
A Lump Sum or Annuity Payments?
This is a popular question that every grand prize lottery winner faces eventually. There is no right or wrong answer to this question, but it all depends on your preference and your specific situation. Each option has its own tax implications, which we’ll get into a bit below.
Many people choose the lump sum option because they have big things they want to do with that money, and they don’t want to wait. Others will choose the annuity option to dole out their money slowly.
A financial planner who specializes in lottery winnings, a tax attorney or a certified public accountant can help you make the best choice between lump sum and annuity. They can calculate the tax burden of each option and let you know which option gives you the majority of your winnings.
Minimize Your Tax Burden After Winning the Lottery
Now that we know how much lottery winnings are taxed, the next thing to think about is how to ensure you receive the most of your winnings as possible. The same professionals we referenced above can help you to minimize your tax burden after winning the lottery.
They can guide you through investing your lottery winnings to make sure they last a long time (such as in a retirement account). If you want to give some of the money away, they can help you determine how much and where to avoid additional taxes or even potentially reduce your tax burden (such as a credit that is provided when donating to charity.)
*Jackpocket does not provide tax, legal or accounting advice. This material has been prepared for informational purposes only, and is not intended to provide, and should not be relied on for, tax, legal or accounting advice. You should consult your own tax, legal and accounting advisors regarding your federal and state taxes.
This article originally appeared on Jackpocket.com and was syndicated by MediaFeed.org.
More from MediaFeed:
This is the #1 State for Lotto Losers

After a years of high inflation, many Americans may dream more about unlimited wealth. Record-high and near-record-high lottery jackpots occurred over the past couple of years — a $2.04 billion Powerball jackpot in November 2022 and a $1.337 billion Mega Millions jackpot in July.
In light of these life-changing jackpots, LendingTree researchers looked at how much people are spending on lotteries by state — and whether they can afford it. Additionally, we asked nearly 2,000 U.S. consumers about their lottery attitudes and habits. Here’s what we found.
Depositphotos.com- Massachusetts residents spent the most per capita on lottery tickets and scratch-offs. Residents spent $805.30 per capita in 2020 — the latest available data — dwarfing fellow Northeastern states New York ($455.93) and Rhode Island ($429.88). Meanwhile, North Dakota residents spent only $32.24 per capita, below Wyoming ($40.97) and Montana ($58.62).
- There’s a saying that you have to spend money to make money, and Massachusetts residents playing the lottery are doing that. Residents got back 70 cents in lottery prize money for every dollar they spent in 2020 — the second-highest after Missouri (71 cents) and ahead of three states at 69 cents. In South Dakota, payouts were only 19 cents per dollar spent, below West Virginia (22 cents) and Oregon (23 cents).
- Combining these elements to compare sales to payouts, Rhode Island residents lost the most cash on lotteries. Rhode Island residents had the worst deficit — the amount spent per capita minus prize payouts per capita — at $281.63 in 2020, followed by West Virginia ($249.81) and Massachusetts ($244.49). The states that spent the least overall had the smallest deficits: North Dakota ($15.69), Wyoming ($17.31) and Montana ($24.60).
- Spending and losses only tell part of the story, though, even if Massachusetts remained at the top of the list of states where residents spent the biggest share of their personal income on lotteries. Massachusetts residents still dominated — they spent $10.26 for every $1,000 of personal income in the state in 2020 — but Georgia ($8.29) and South Carolina ($8.27) joined the conversation for the first time.
- Knowing where their state lands on spending and payouts could be important to the 60% of Americans who play the lottery. A separate LendingTree survey found that 86% of lottery players buy scratch-offs, while 65% buy tickets. Amid last month’s Powerball craze, more than half of Americans (58%) say they’d prefer a lump-sum payment if they beat the odds and won the lottery.
To determine consumers’ per-capita lottery spending, LendingTree researchers analyzed ticket sales (excluding commissions) in 2020 by state. Researchers then added the estimated commissions that participating stores receive for selling a winning ticket, estimating a rate of 5.5% based on data from Playport — an online gambling platform used by lottery retailers.
- To determine the amount consumers won per dollar spent, researchers divided lottery prize payouts per capita by lottery sales per capita.
- To determine the amount consumers lost, researchers subtracted lottery prize payouts per capita from the lottery sales per capita.
However, personal incomes in some states are low enough that the losses may be more meaningful — even if the total loss is lower. To determine which states can least afford lottery losses, researchers compared lottery sales to statewide personal incomes in 2020. Researchers looked at lottery sales and losses per $1,000 in personal income in the state.
The following states don’t have lotteries: Alabama, Alaska, Hawaii, Nevada and Utah.
LendingTree researchers analyzed lottery data from the U.S. Census Bureau 2020 Annual Survey of State Government Finance — the latest available. Researchers also used the U.S. Bureau of Economic Analysis (BEA) revised 2020 estimates on state personal income.
Analysts estimated the amount spent by residents of each state on lotteries (annual ticket sales excluding commissions, plus an assumed 5.5% in commissions), prize payouts and net losses on a per-capita basis, as well as the amount spent, won and lost on lotteries per $1,000 in statewide personal income. Losses are defined as total estimated sales minus total prize payouts.
Population data for 2020 is from the BEA. The following states don’t have lotteries and were excluded from our analysis: Alabama, Alaska, Hawaii, Nevada and Utah.
Separately, LendingTree commissioned Qualtrics to conduct an online survey of 2,033 U.S. consumers ages 18 to 76 on Oct. 18, 2022. The survey was administered using a nonprobability-based sample, and quotas were used to ensure the sample base represented the overall population. All responses were reviewed by researchers for quality control.
We defined generations as the following ages in 2022:
- Generation Z: 18 to 25
- Millennial: 26 to 41
- Generation X: 42 to 56
- Baby boomer: 57 to 76
Which states have the biggest lottery losers?

Lottery sales per capita: $32.24
Lottery prize payouts per capita: $16.55
Losses per capita: $15.69
DepositPhotos.com
Lottery sales per capita: $40.97
Lottery prize payouts per capita: $23.66
Losses per capita: $17.31

Lottery sales per capita: $58.62
Lottery prize payouts per capita: $34.02
Losses per capita: $24.6

Lottery sales per capita: $71.23
Lottery prize payouts per capita: $41.87
Losses per capita: $29.36
DepositPhotos.com
Lottery sales per capita: $63.83
Lottery prize payouts per capita: $32.42
Losses per capita: $31.41
DepositPhotos.com
Lottery sales per capita: $101.34
Lottery prize payouts per capita: $68.92
Losses per capita: $32.42
gmc3101 / iStock
Lottery sales per capita: $99.89
Lottery prize payouts per capita: $66.83
Losses per capita: $33.06
SeanPavonePhoto/istockphoto
Lottery sales per capita: $90.54
Lottery prize payouts per capita: $57.15
Losses per capita: $33.39
fotoguy22 / iStock
Lottery sales per capita: $110.94
Lottery prize payouts per capita: $73.10
Losses per capita: $37.84
Jacob Boomsma / istockphoto
Lottery sales per capita: $93.78
Lottery prize payouts per capita: $55.88
Losses per capita: $37.90
Matt Bills / iStock
Lottery sales per capita: $116.67
Lottery prize payouts per capita: $77.82
Losses per capita: $38.85
Jacob Boomsma
Lottery sales per capita: $116.28
Lottery prize payouts per capita: $74.70
Losses per capita: $41.58
JoeChristensen
Lottery sales per capita: $148.08
Lottery prize payouts per capita: $101.73
Losses per capita: $46.35

Lottery sales per capita: $124.18
Lottery prize payouts per capita: $77.76
Losses per capita: $46.42

Lottery sales per capita: $145.93
Lottery prize payouts per capita: $99.43
Losses per capita: $46.50

Lottery sales per capita: $109.40
Lottery prize payouts per capita: $59.83
Losses per capita: $49.57

Lottery sales per capita: $185.57
Lottery prize payouts per capita: $121.96
Losses per capita: $63.61
doug_wertman/Flickr
Lottery sales per capita: $178.00
Lottery prize payouts per capita: $111.86
Losses per capita: $66.14
nata_rass/ istockphoto
Lottery sales per capita: $201.99
Lottery prize payouts per capita: $135.33
Losses per capita: $66.66

Lottery sales per capita: $218.53
Lottery prize payouts per capita: $147.02
Losses per capita: $71.51

Lottery sales per capita: $229.87
Lottery prize payouts per capita: $158.25
Losses per capita: $71.62

Lottery sales per capita: $229.08
Lottery prize payouts per capita: $151.30
Losses per capita: $77.78

Lottery sales per capita: $244.79
Lottery prize payouts per capita: $172.72
Losses per capita: $72.07

Lottery sales per capita: $239.26
Lottery prize payouts per capita: $158.57
Losses per capita: $80.69

Lottery sales per capita: $267.64
Lottery prize payouts per capita: $178.96
Losses per capita: $88.68

Lottery sales per capita: $274.82
Lottery prize payouts per capita: $184.66
Losses per capita: $90.16

Lottery sales per capita: $238.90
Lottery prize payouts per capita: $146.35
Losses per capita: $92.55

Lottery sales per capita: $249.80
Lottery prize payouts per capita: $153.44
Losses per capita: $96.36

Lottery sales per capita: $293.03
Lottery prize payouts per capita: $193.21
Losses per capita: $99.82

Lottery sales per capita: $285.91
Lottery prize payouts per capita: $180.69
Losses per capita: $105.22

Lottery sales per capita: $342.70
Lottery prize payouts per capita: $229.01
Losses per capita: $113.69

Lottery sales per capita: $345.25
Lottery prize payouts per capita: $231.45
Losses per capita: $113.80

Lottery sales per capita: $397.11
Lottery prize payouts per capita: $272.94
Losses per capita: $124.17

Lottery sales per capita: $354.03
Lottery prize payouts per capita: $226.07
Losses per capita: $127.96

Lottery sales per capita: $325.01
Lottery prize payouts per capita: $191.76
Losses per capita: $133.25

Lottery sales per capita: $366.63
Lottery prize payouts per capita: $231.16
Losses per capita: $135.47

Lottery sales per capita: $361.00
Lottery prize payouts per capita: $221.74
Losses per capita: $139.26

Lottery sales per capita: $408.51
Lottery prize payouts per capita: $264.89
Losses per capita: $143.62

Lottery sales per capita: $429.51
Lottery prize payouts per capita: $284.37
Losses per capita: $145.14

Lottery sales per capita: $207.97
Lottery prize payouts per capita: $40.49
Losses per capita: $167.48

Lottery sales per capita: $231.37
Lottery prize payouts per capita: $52.69
Losses per capita: $178.68

Lottery sales per capita: $455.93
Lottery prize payouts per capita: $239.11
Losses per capita: $216.82

Lottery sales per capita: $805.30
Lottery prize payouts per capita: $560.81
Losses per capita: $244.49

Lottery sales per capita: $321.44
Lottery prize payouts per capita: $71.63
Losses per capita: $249.81

Lottery sales per capita: $429.88
Lottery prize payouts per capita: $148.25
Losses per capita: $281.63
This article originally appeared on LendingTree.com and was syndicated by MediaFeed.org.
DepositPhotos.com