Life Expectancy in the Year You Were Born

Rising or Falling?
U.S. life expectancy continues to shorten — dropping by more than seven months in 2021, according to data from the Centers for Disease Control and Prevention. Life expectancy for U.S.-born children is now 76.4 years, its lowest point in nearly two decades. Deaths caused by drug overdoses and COVID-19 infections were key contributors to the decline, the CDC data showed. COVID-19 took nearly 417,000 lives in 2021 — more than in 2020 — and for the second year was the third leading cause of deaths.
This week, Food and Drug Administration chief Dr. Robert Califf also noted another reason why U.S. life expectancy is lagging behind other high-income countries' figures: medical misinformation on the internet, something he said he aims to root out.
If you're wondering what life expectancy was the year you were born and how it’s changed, the numbers going back to 1940 tell the tale.
Related: Can You Guess the Minimum Wage the Year You Were Born?

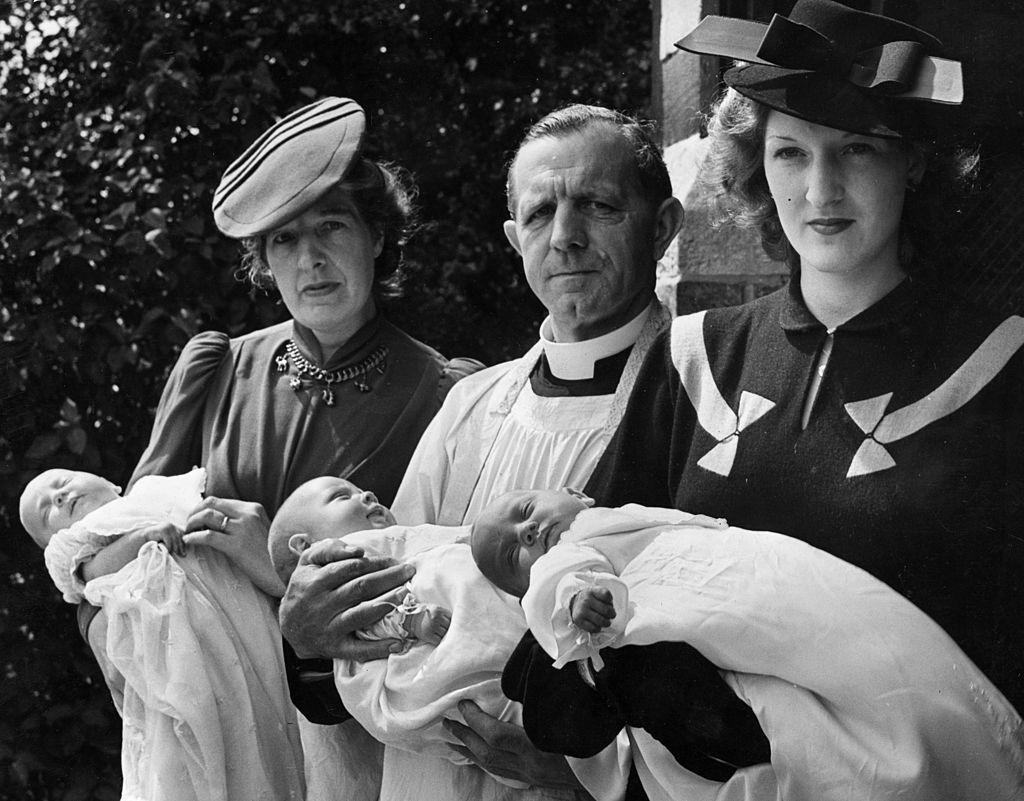
1940
Overall life expectancy: 62.9
Women: 65.2
Men: 60.8
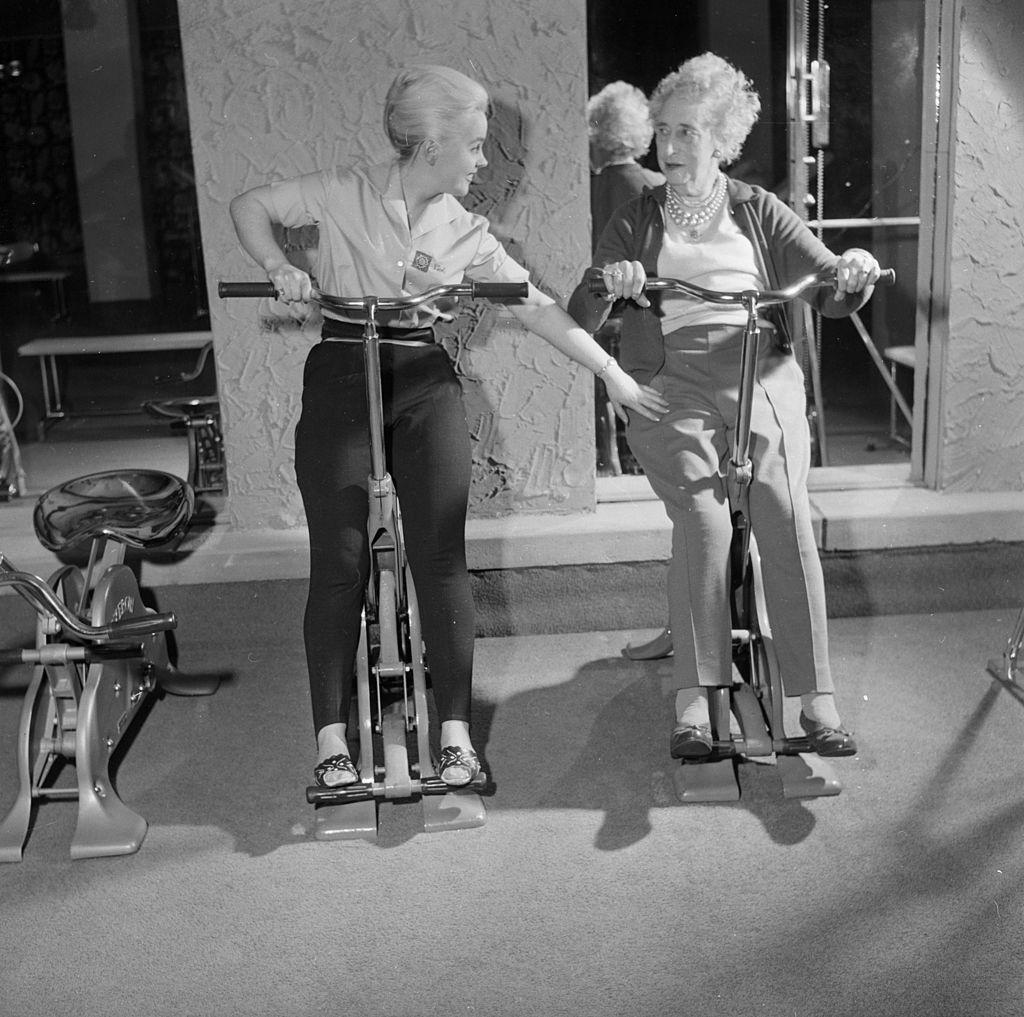
The United States began the ’40s on an upswing, with life expectancy up sharply from 58.5 years in 1936, when the nation was still struggling with the economic devastation of the Great Depression. The ’40s would also bring significant public-health landmarks, including the mass production of penicillin and the DTP shot, which combined the pertussis, diphtheria, and tetanus vaccines.
Related: Things We Can Learn From the Great Depression

1941
Overall life expectancy: 64.8
Women: 66.8
Men: 63.1
1942
Overall life expectancy: 66.2
Women: 67.9
Men: 64.7

1943
Overall life expectancy: 63.3
Women: 64.4
Men: 62.4
Life expectancy dropped almost three years from 1942 to 1943. Though World War II may have driven a decline, a change in how life expectancy was calculated beginning in 1948 may have made the drop look more dramatic than it really was, scholars say.
For more interesting trivia, please sign up for our free newsletters.

1944
Overall life expectancy: 65.2
Women: 66.8
Men: 63.6

1945
Overall life expectancy: 65.9
Women: 67.9
Men: 63.6

1946
Overall life expectancy: 66.7
Women: 69.4
Men: 64.4

1947
Overall life expectancy: 66.8
Women: 69.7
Men: 64.4

1948
Overall life expectancy: 67.2
Women: 69.9
Men: 64.6

1949
Overall life expectancy: 68
Women: 70.7
Men: 65.2
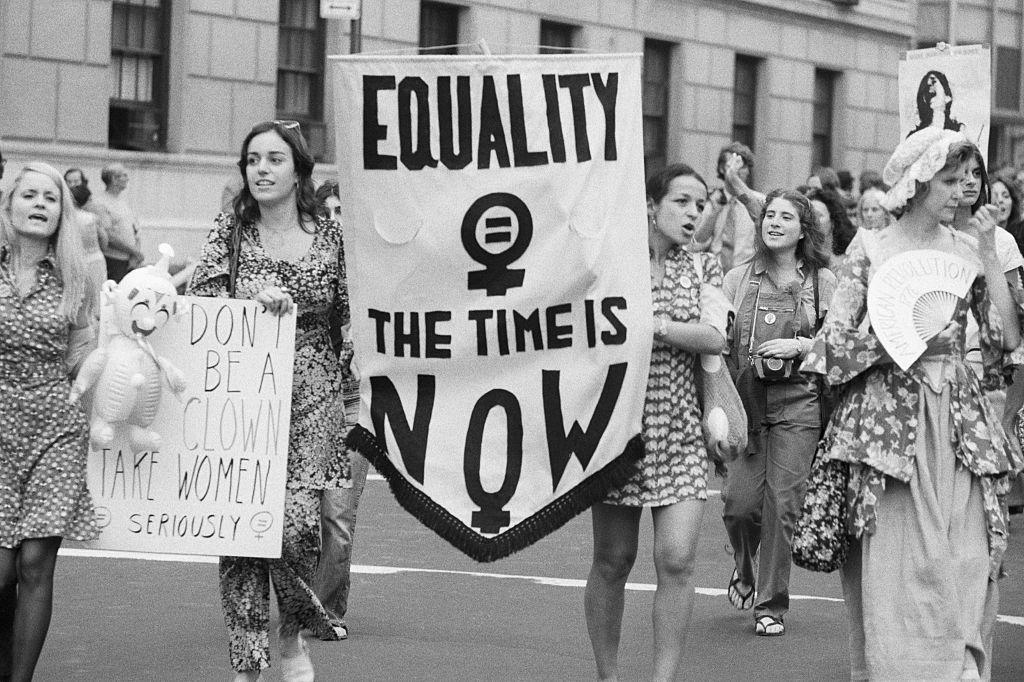
1949 marked the first year women’s life expectancy eclipsed 70 — a milestone men would not reach for another three decades. Experts have long documented that women tend to outlive men, attributing the difference to several factors. Among them: Men take more risks, are less likely to seek medical care, and are more likely to die of heart disease and suicide. 1949 was also the last time the U.S. saw an outbreak of smallpox.

1950
Overall life expectancy: 68.2
Women: 71.1
Men: 65.6

1951
Overall life expectancy: 68.4
Women: 71.4
Men: 65.6

1952
Overall life expectancy: 68.6
Women: 71.6
Men: 65.8

1953
Overall life expectancy: 68.8
Women: 72
Men: 66
1954
Overall life expectancy: 69.6
Women: 72.8
Men: 66.7

1955
Overall life expectancy: 69.6
Women: 72.8
Men: 66.7
In 1955, a nationwide push to inoculate children against polio began after trials found Dr. Jonas Salk’s vaccine was safe and effective. New polio cases dropped to less than 6,000 in 1957 from 58,000 in 1952.

1956
Overall life expectancy: 69.7
Women: 72.9
Men: 66.7
1957
Overall life expectancy: 69.5
Women: 72.7
Men: 66.4
Though it was nowhere near as devastating as the 1918 pandemic that killed 50 million worldwide, the flu killed more than 116,000 in the United States and 1.1 million worldwide in 1957-58.

1958
Overall life expectancy: 69.6
Women: 72.9
Men: 66.6

1959
Overall life expectancy: 69.9
Women: 73.2
Men: 66.8
1960
Overall life expectancy: 69.7
Women: 73.1
Men: 66.6
By 1960, life expectancy numbers settled into a long-term pattern of slow but steady growth compared with more dramatic jumps at the beginning of the century. From 1950 to 1960, life expectancy grew 1.5 years, compared with a jump of more than five years from 1940 to 1950, more than three years from 1930 to 1940, and more than five years from 1920 to 1930.
1961
Overall life expectancy: 70.2
Women: 73.6
Men: 67.1
1962
Overall life expectancy: 70.1
Women: 73.5
Men: 66.9
1963
Overall life expectancy: 69.9
Women: 73.4
Men: 66.6

1964
Overall life expectancy: 70.2
Women: 73.7
Men: 66.8
The U.S. government made waves in 1964 when the surgeon general released a landmark report that said cigarettes caused lung and throat cancer in men, and likely caused lung cancer in women.

1965
Overall life expectancy: 70.2
Women: 73.8
Men: 66.8

1966
Overall life expectancy: 70.2
Women: 73.9
Men: 66.7

1967
Overall life expectancy: 70.5
Women: 74.3
Men: 67

1968
Overall life expectancy: 70.2
Women: 74.1
Men: 66.6
About a decade after the 1957-58 pandemic, yet another flu pandemic killed about 100,000 people in the U.S. and more than 1 million worldwide.
Related: Famous Places to Revisit the 1960s in America and Beyond

1969
Overall life expectancy: 70.5
Women: 74.4
Men: 66.8
1970
Overall life expectancy: 70.8
Women: 74.7
Men: 67.1
Life expectancy was relatively flat in the ’60s, rising less than a year from 1960 to 1970. Women added about 18 months to their lifespans, while men added only half a year. The ’60s also brought three significant vaccines against measles, mumps, and rubella, which were eventually combined into the MMR shot in 1971.
Related: The Greatest American Inventions of the Past 50+ Years

1971
Overall life expectancy: 71.1
Women: 75
Men: 67.4

1972
Overall life expectancy: 71.2
Women: 75.1
Men: 67.4

1973
Overall life expectancy: 71.4
Women: 75.3
Men: 67.6

1974
Overall life expectancy: 72
Women: 75.9
Men: 68.2
1975
Overall life expectancy: 72.6
Women: 76.6
Men: 68.8

1976
Overall life expectancy: 72.9
Women: 76.8
Men: 69.1

1977
Overall life expectancy: 73.3
Women: 77.2
Men: 69.5

1978
Overall life expectancy: 73.5
Women: 77.3
Men: 69.6

1979
Overall life expectancy: 73.9
Women: 77.8
Men: 70

1980
Overall life expectancy: 73.7
Women: 77.4
Men: 70
A particularly deadly flu season again was to blame for the drop in life expectancy in 1980, the nation’s first since 1968.

1981
Overall life expectancy: 74.1
Women: 77.8
Men: 70.4

1982
Overall life expectancy: 74.5
Women: 78.1
Men: 70.8
1983
Overall life expectancy: 74.6
Women: 78.1
Men: 71

1984
Overall life expectancy: 74.7
Women: 78.2
Men: 71.1
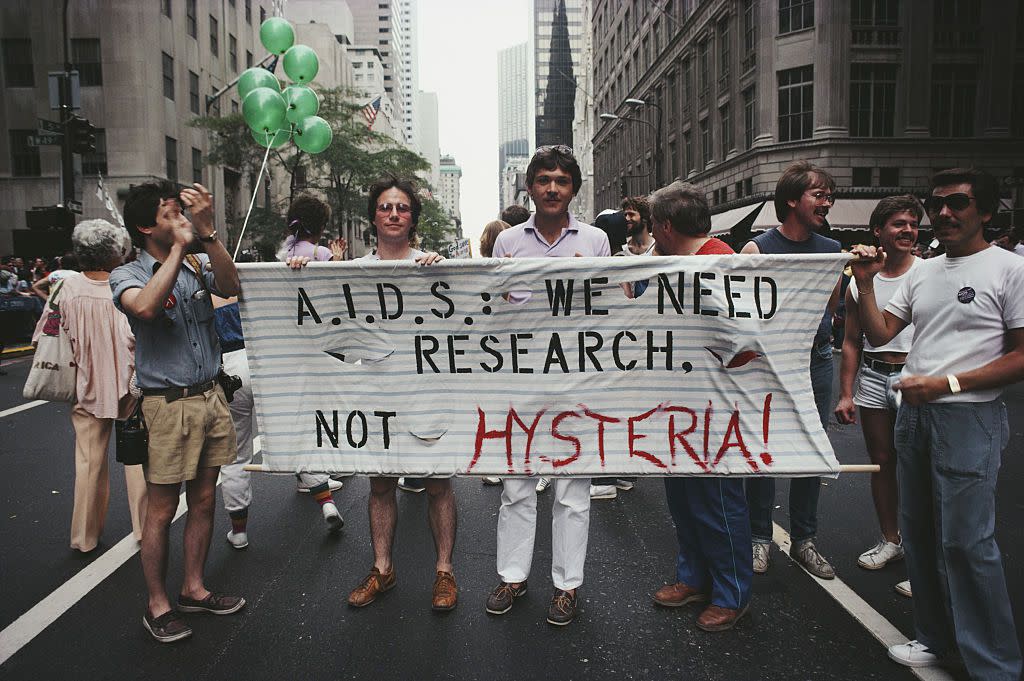
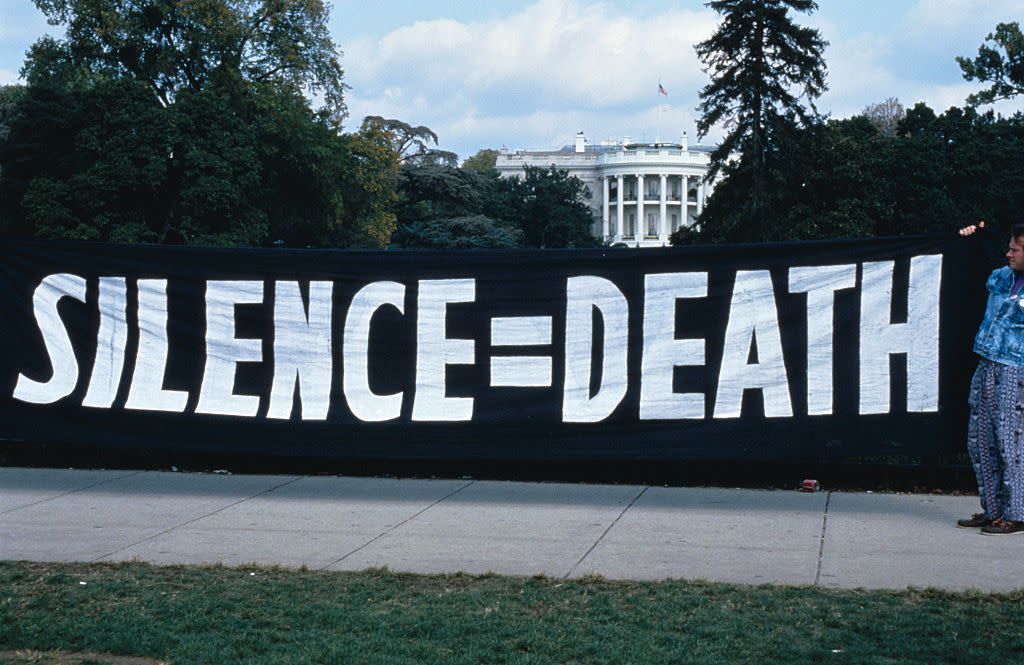
Three years after the CDC identified the first-known cluster of AIDS cases in the U.S. in 1981, researchers determined the cause of the disease: HIV. The first commercially available HIV test would become available in 1985, and the first antiretroviral to fight HIV followed in 1987.

1985
Overall life expectancy: 74.7
Women: 78.2
Men: 71.1
In 1985, New York became the first state to require drivers to wear seat belts or risk a fine. Every state but New Hampshire eventually followed suit. In the early ’80s, seat belt use was only about 14%; today, it’s about 90%.
Related: 16 Ways Driving Has Changed in the Past 50 Years

1986
Overall life expectancy: 74.7
Women: 78.2
Men: 71.2

1987
Overall life expectancy: 74.9
Women: 78.3
Men: 71.4
This year marked a major milestone for the fight against heart disease, when lovastatin became the first such cholesterol-lowering drug approved for commercial use in the U.S. Several other statins followed, including familiar names such as atorvastatin (perhaps better known as Lipitor).

1988
Overall life expectancy: 74.9
Women: 78.3
Men: 71.4

1989
Overall life expectancy: 75.1
Women: 78.5
Men: 71.7

1990
Overall life expectancy: 75.4
Women: 78.8
Men: 71.8

1991
Overall life expectancy: 75.5
Women: 78.9
Men: 72

1992
Overall life expectancy: 75.8
Women: 79.1
Men: 72.3
1993
Overall life expectancy: 75.5
Women: 78.8
Men: 72.2
In 1993, the U.S. notched its first significant decline in life expectancy since 1980, a blip that experts attributed to several factors: AIDS, a deadly flu season, and high accidental-death and murder rates for the year.

1994
Overall life expectancy: 75.7
Women: 79
Men: 72.4

1995
Overall life expectancy: 75.8
Women: 78.9
Men: 72.5

1996
Overall life expectancy: 76.1
Women: 79.1
Men: 73.1
1997
Overall life expectancy: 76.5
Women: 79.4
Men: 73.6
1998
Overall life expectancy: 76.7
Women: 79.5
Men: 73.8

1999
Overall life expectancy: 76.7
Women: 79.4
Men: 73.9

2000
Overall life expectancy: 76.8
Women: 79.7
Men: 74.3

2001
Overall life expectancy: 77
Women: 79.5
Men: 74.3

2002
Overall life expectancy: 77
Women: 79.6
Men: 74.4

2003
Overall life expectancy: 77.6
Women: 79.7
Men: 74.5

2004
Overall life expectancy: 77.5
Women: 80.1
Men: 75

2005
Overall life expectancy: 77.6
Women: 80.1
Men: 75

2006
Overall life expectancy: 77.8
Women: 80.3
Men: 75.2

2007
Overall life expectancy: 78.1
Women: 80.6
Men: 75.5

2008
Overall life expectancy: 78.2
Women: 80.6
Men: 75.6

2009
Overall life expectancy: 78.5
Women: 80.9
Men: 76

2010
Overall life expectancy: 78.7
Women: 81
Men: 76.2

2011
Overall life expectancy: 78.7
Women: 81.1
Men: 76.3

2012
Overall life expectancy: 78.8
Women: 81.2
Men: 76.4

2014
Overall life expectancy: 78.9
Women: 81.3
Men: 76.5

2015
Overall life expectancy: 78.7
Women: 81.1
Men: 76.3
In 2015, life expectancy backed off from its 2014 peak of 78.9. Several factors were at play, researchers say, including an increasing number of midlife deaths from the opioid crisis.
Related: How Long Can You Expect to Live in America's Biggest Cities?

2016
Overall life expectancy: 78.7
Women: 81.1
Men: 76.2

2017
Overall life expectancy: 78.6
Women: 81.1
Men: 76.1

2018
Overall life expectancy: 78.7
Women: 81.2
Men: 76.2

2019
Overall life expectancy: 78.8
Women: 81.4
Men: 76.3

2020
Overall life expectancy: 77
Women: 79.9
Men: 74.2
The U.S. recorded a more than one-year drop in life expectancy after the coronavirus outbreak evolved into a pandemic in early 2020. Researchers express optimism that the number would rebound, but noted that deaths disproportionately affected communities of color.

2021
Overall life expectancy: 76.4
Women: 79.3
Men: 73.5
On average in 2021, life expectancy for men fell quicker than women, widening a gap that had been growing over the past decade. The CDC also noted that white people saw more deaths from COVID-19 in the second year of the pandemic than any other racial or ethnic group in the U.S. The increased mortality rate resulted in white people experiencing the second-biggest decline in life expectancy.
