Internal government maps show the dramatic acceleration of a COVID 'red wave'

WASHINGTON — As the U.S. passed another milestone in the death toll from COVID-19 this week, nearly every measure of the pandemic shows a dramatic worsening, rendered starkly apparent in maps for the White House created by the departments of health and human services and homeland security.
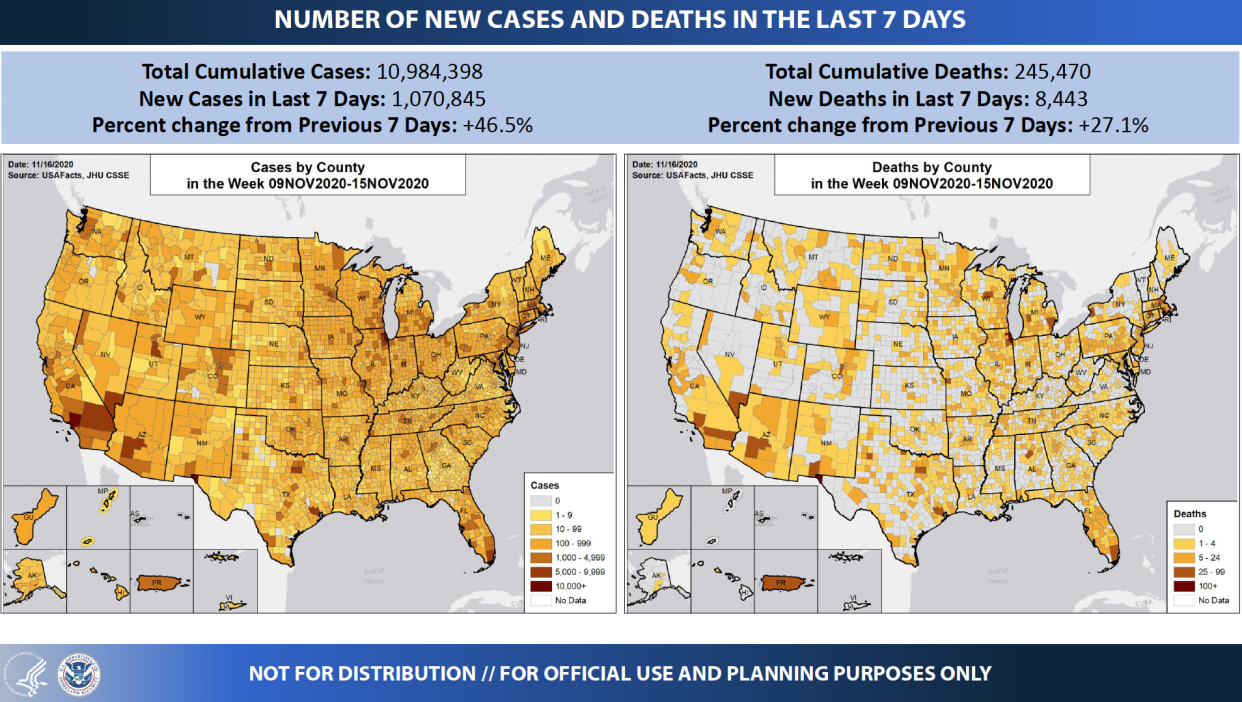
Rising COVID-19 rates are already well documented by publicly available data, which shows the pandemic has now killed more than 250,000 Americans. But the HHS and DHS maps point to the dramatic week-over-week spike across a number of measures, including cumulative new cases, case incidence per 100,000 people, deaths and mortality rate.
The maps, dated Nov. 16 and marked for “official use only,” are part of a Community Profile Report, a 21-page document prepared by the DHS and HHS and distributed to the White House coronavirus task force, among others inside the government.
For the week ending Nov. 15, a map of “incidence rates” shows a large swath of the country draped in dark red, indicating counties with more than 500 cases per 100,000 people. The nationwide incidence was almost 323 per 100,000, a startling increase of more than 46 percent week over week, when much of the country was still coded pink.

Another map, of overall deaths, shows a 27 percent increase compared to the previous week, which is mirrored by a mortality rate that also increased by 27 percent. The case fatality rate, once touted by President Trump as evidence that the U.S. was conquering the pandemic, has also ticked up slightly over the last seven days.
Another sign of the pandemic’s acceleration is the number of counties where rates are rising rapidly. According to a senior leadership brief prepared by HHS and obtained by Yahoo News, as of Nov. 12 there were more counties — 147 — identified as “Rapid Risers” — or hot spots — than at any time since the pandemic started.

While the internal government maps and documents include some additional information not yet released to the public, the overall message of concern about the pandemic is similar to what Dr. Deborah Birx, coordinator of the White House coronavirus task force, conveyed on Thursday afternoon.
Speaking at the White House with Vice President Mike Pence and Dr. Anthony Fauci, she showed a series of maps and charts that pointed to general worsening trends.
“This is really a call to action to every American to increase their vigilance. Because of the graphic that is shown here,” she said, showing a chart outlining the different waves of the pandemic.
“I wanted to show the difference in slopes between the spring surge, the summer surge and fall surge,” she said. “So the American people know: This is more cases, more rapidly, than what we had seen before.”
_____
Read more from Yahoo News:
