Hurricane spaghetti models: What are they and how do you read them?
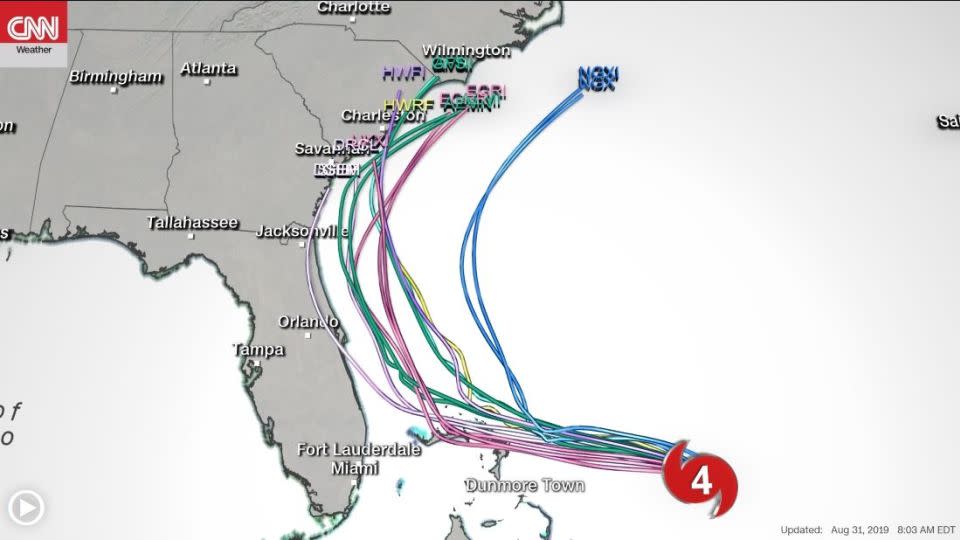
There’s a reason these maps are called spaghetti models. Just take a look. There are lines all over the place, like a plate of spaghetti.
The simple lines actually come from some of the fastest computers in the world, making billions of computations.
Also known as spaghetti plots, these models show where a tropical system, such as a hurricane, may go.
The more they are clustered together, the higher the confidence in the forecast. Lines are spread far apart can indicate uncertainty in the forecast.
Are all spaghetti models the same?
No. There are different kinds of spaghetti models: dynamical models, statistical models and ensemble models.
Dynamical models require hours on a supercomputer solving physical equations of motion to produce a forecast.
Statistical models, in contrast, are based on historical relationships between storm behavior and storm-specific details such as location and date.
Ensemble or consensus models are created by combining the forecasts from a collection of other models.
All models show the expected track of the storm and many also show how strong the storm will be.
Who makes them?
Models are run and operated by governments and private companies around the world. Some are public, while others are private.
Usually, the name of the model can give away who is responsible.
Take, for example, the “Navy Global Environmental Model” which is run by the United States Navy’s Fleet Numerical Meteorology and Oceanography Center.
Some of the more familiar models are the American (GFS) and European (ECMWF) models run by the US government and a partnership of European countries respectively.
The combination of plotting them all on one map is done by various companies. For example, CNN uses a software company to plot the most recent models on our CNN storm tracker when tracking active storms.
When is a good time to check the models?
The easy answer is all the time. These models run multiple times a day and can change very quickly.
The key is to look for trends. In other words, did all the models shift to the north or south – or do most of the models show the storm moving faster?
The other is consistency. Are the plots moving north, for instance, and have they done that the last three times you looked?
While no forecast is perfect, spaghetti models do a great job at giving us an idea where these powerful forces of nature will go.
This helps us better prepare for when a hurricane strikes.
For more CNN news and newsletters create an account at CNN.com
