Housing Market 2023: Home Prices Jumped the Most in These Cities the Past Five Years
The average home sales price in the United States was $495,100 at the end of 2023’s second quarter, according to the Federal Reserve Bank of St. Louis. While this is still much higher than it has been in previous years, it’s actually a slight decrease from this time last year, when the average home sales price was $527,500.
Housing Market 2023: 40 Places Poised for a Housing Crisis
Check Out: 3 Things You Must Do When Your Savings Reach $50,000
With that being said, many parts of the United States have seen a significant increase in housing prices in the past five years. This has made it more difficult for many prospective buyers to afford property, particularly in more expensive areas.
Whether you’re a prospective homebuyer or you’re looking for your next investment property, it’s important to choose the right location based on your goals and needs. A big part of making an informed decision means knowing the housing market in the area where you’re interested in buying.
Using data from the Zillow Home Values Index (ZHVI), GOBankingRates analyzed and ranked the country’s 500 biggest housing markets to find the largest changes in home values from 2018 to 2023.
Here are the 10 most significant five-year dollar changes in home value, followed by the 10 biggest percent changes in home values throughout the country.
10 Cities With the Biggest 5-year Dollar Changes in Home Values
The following U.S. cities have experienced the largest dollar change in property value in the past five years.
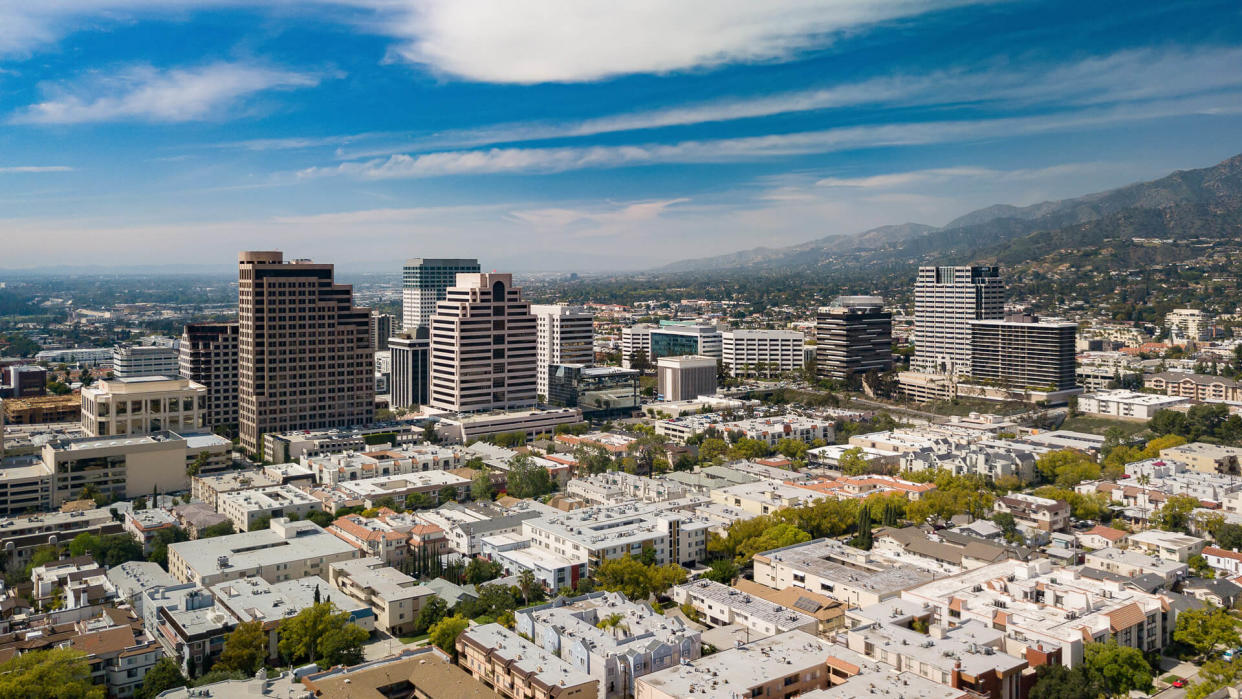
10. Glendale, California
June 2018 home value: $915,551
June 2023 home value: $1,273,741
5-year change in home value: $358,190
9. Huntington Beach, California
June 2018 home value: $914,218
June 2023 home value: $1,273,269
5-year change in home value: $359,051
8. Santa Cruz, California
June 2018 home value: $991,513
June 2023 home value: $1,351,589
5-year change in home value: $360,076
7. Costa Mesa, California
June 2018 home value: $862,816
June 2023 home value: $1,241,762
5-year change in home value: $378,946
6. Franklin, Tennessee
June 2018 home value: $489,575
June 2023 home value: $869,263
5-year change in home value: $379,689
5. Redmond, Washington
June 2018 home value: $989,938
June 2023 home value: $1,371,719
5-year change in home value: $381,781
4. Bellevue, Washington
June 2018 home value: $1,135,164
June 2023 home value: $1,534,304
5-year change in home value: $399,140
3. Irvine, California
June 2018 home value: $1,051,427
June 2023 home value: $1,494,791
5-year change in home value: $443,365
2. Carlsbad, California
June 2018 home value: $963,690
June 2023 home value: $1,513,784
5-year change in home value: $550,095
1. Santa Barbara, California
June 2018 home value: $1,100,714
June 2023 home value: $1,799,893
5-year change in home value: $699,180
I’m a Real Estate Agent: 12 Costly Red Flags I Look for During a Home Inspection
10 Cities With the Biggest 5-Year Percent Change in Home Values
Listed below are the 10 U.S. locations that have seen the biggest percentage change in property value in the past five years.
10. Gastonia, North Carolina
June 2018 home value: $153,637
June 2023 home value: $281,152
5-year change in home value: 83%
9. Covington, Georgia
June 2018 home value: $159,479
June 2023 home value: $292,407
5-year change in home value: 83.35%
8. Augusta, Georgia
June 2018 home value: $96,115
June 2023 home value: $176,849
5-year change in home value: 84%
7. Harrisburg, Pennsylvania
June 2018 home value: $127,273
June 2023 home value: $235,369
5-year change in home value: 84.93%
6. Saint Petersburg, Florida
June 2018 home value: $210,646
June 2023 home value: $392,524
5-year change in home value: 86.34%
5. Dayton, Ohio
June 2018 home value: $58,720
June 2023 home value: $110,152
5-year change in home value: 87.59%
4. Reading, Pennsylvania
June 2018 home value: $122,129
June 2023 home value: $230,876
5-year change in home value: 89.04%
3. Birmingham, Alabama
June 2018 home value: $52,003
June 2023 home value: $99,433
5-year change in home value: 91.21%
2. Trenton, New Jersey
June 2018 home value: $151,399
June 2023 home value: $299,437
5-year change in home value: 97.78%
1. Detroit
June 2018 home value: $22,435
June 2023 home value: $63,661
5-year change in home value: 183.76%
Methodology: For this piece, GOBankingRates looked at the 500 largest housing markets and found the 20 biggest dollar and percent change in home values from June 2018 to June 2023. All data was collected and is up to date as of Aug. 9, 2023.
More From GOBankingRates
The Financial Feng Shui Rule: 7 Chinese Secrets to Attract Wealth
Experts Share the 5 Best Money Moves To Make Before Retiring
This article originally appeared on GOBankingRates.com: Housing Market 2023: Home Prices Jumped the Most in These Cities the Past Five Years
