How the stock market performed under each president
The performance of the volatile stock market typically has little to do with the president who's in office (though 2020 saw numerous exceptions, including a tumble following Donald Trump's positive COVID-19 test in early October).
Mortgage Interest Rate Forecast for 2023: When Will Rates Go Down?
Advice: 3 Things You Must Do When Your Savings Reach $50,000
Even when a president does manage to produce effective economic policies, they're usually well out of office by the time the effects are felt. Nonetheless, presidents tend to be defined by the performance of the stock market during their time in office. So, which presidents have had the most luck, or the least, when it comes to the stock market?
While stocks have been traded throughout U.S. history, the launch of the Dow Jones Industrial average marked the first time anyone tried to track their collective performance in any meaningful way. The Dow debuted in 1896, so William McKinley was the first president to have the Dow exist for his full term. Take a look back at our economic history and see how presidential and stock market performances relate.
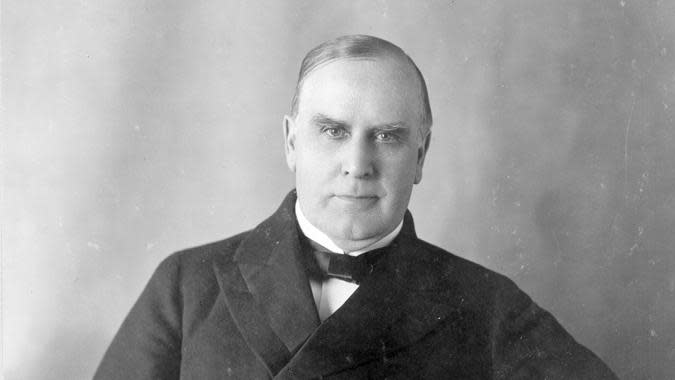
William McKinley
Time in Office: March 4, 1897 - Sept. 14, 1901McKinley was president during a generally favorable atmosphere for heavy industry, allowing for the creation of many monopolies that would come to dominate the economy despite his efforts to publicly condemn them. McKinley was assassinated in 1901, less than a year after securing a second term.
How the Market Performed
Starting Value: 41.34
High Point: 78.26 on June 7, 1901
Low Point: 38.49 on April 19 and April 23, 1897
Ending Value: 67.25
Performance While in Office: 62.68% increase
Not a lot of people still alive can say they remember a time when the Dow was under 40, but it hit that point in the first full year of its existence. Still, McKinley's business-friendly administration oversaw a Dow that jumped more than 60 percent while he served as president.Take Our Poll: Are You Concerned About the Safety of Your Money in Your Bank Accounts?
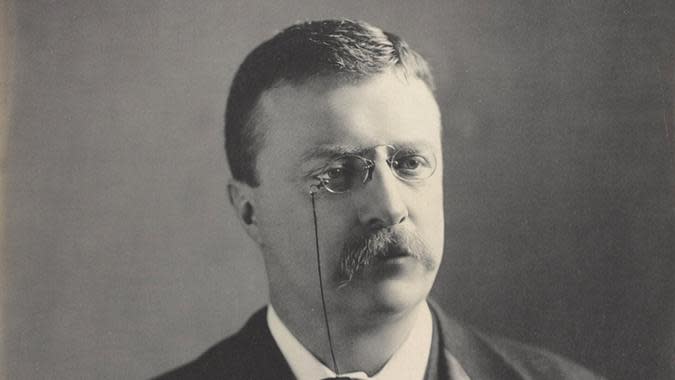
Theodore Roosevelt
Time in Office: Sept. 14, 1901 - March 4, 1909The only president on this list who's on Mount Rushmore, Theodore Roosevelt earned a reputation as a progressive by attacking the trusts that had come to dominate the business world in the early 20th century, ultimately earning him the nickname "The Trust Buster." TR would run for president again in 1912 under the Progressive Party, better known as the Bull Moose Party, but ultimately lost to Woodrow Wilson.
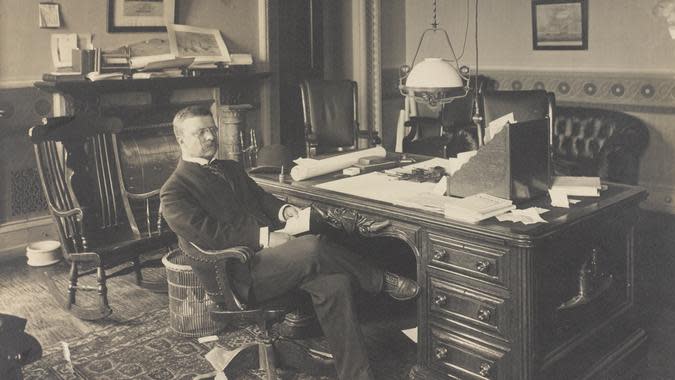
How the Market Performed
Starting Value: 70.01
High Point: 103 on Jan. 19, 1906
Low Point: 42.15 on Nov. 9, 1903
Ending Value: 82.58
Performance While in Office: 17.95% increase
Roosevelt's trust-busting didn't appear to be an enormous weight on the growth of stock prices. He was in office the first time the Dow cleared the century mark.
William H. Taft
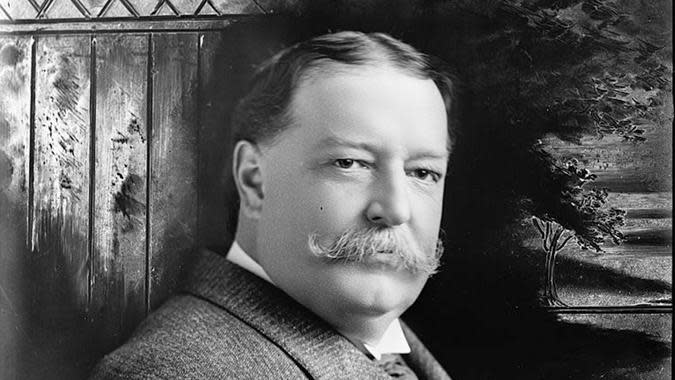
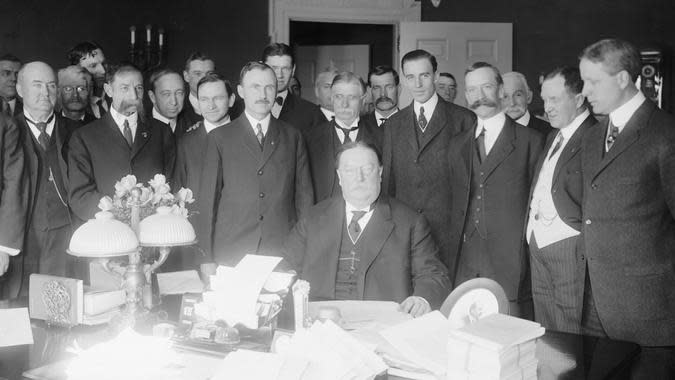
Time in Office: March 4, 1909 - March 4, 1913Taft was actually more aggressive in breaking up monopolies than Roosevelt — initiating some 80 anti-trust suits — but didn't get nearly the credit for his efforts in economic reform. Taft also oversaw amendments to the Constitution that legalized the federal income tax and provided for the direct election of U.S. senators.
How the Market Performed
Starting Value: 81.79
High Point: 100.53 on Nov. 19, 1909
Low Point: 72.94 on Sept. 25, 1911
Ending Value: 81.33
Performance While in Office: -0.56% decrease
Taft had the misfortune of taking office just before the market peaked later that year, making him the first president on this list to see the Dow decline on his watch. Even so, the index did improve considerably from its lowest point in 1911. Taft left office with the Dow less than a half-point lower than at the start of his term.
Woodrow Wilson
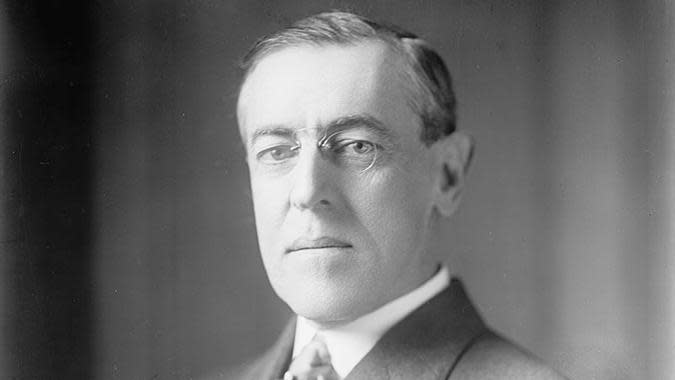
Time in Office: March 4, 1913 - March 4, 1921World War I and the sale of armaments and other goods to combatants in Europe proved a boon to American industry, and the economy grew quickly under the first Democrat on this list. Wilson, though, would have a miserable end to his presidency, failing to get the Senate to ratify the Treaty of Versailles he had played a crucial role in crafting. He also suffered the stroke that would lead to his death less than four years after leaving office.

How the Market Performed
Starting Value: 80.71
High Point: 119.62 on Nov. 3, 1919
Low Point: 53.17 on Dec. 24, 1914
Ending Value: 75.23
Performance While in Office: -6.79% decrease
The Dow would almost halve itself in the first two years of the Wilson era, but the advent of World War I changed that trend. From its low point on Christmas Eve of 1914 to its high point a year after the end of The Great War, the Dow would more than double. Of course, the index reversed direction once again, losing more than a third of its value from November 1919 to the end of Wilson's presidency and ultimately leaving it down almost 7% during his time in office.
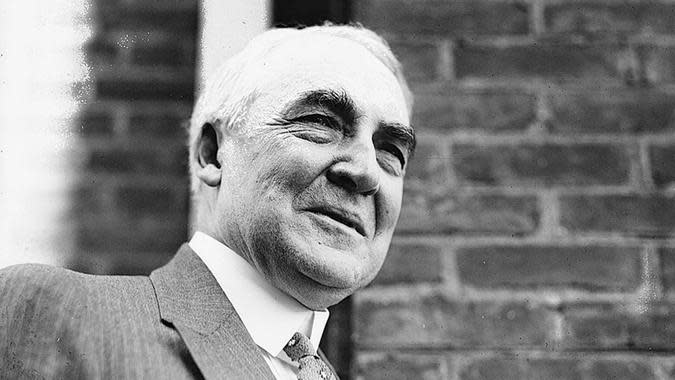
Warren G. Harding
Time in Office: March 4, 1921 - Aug. 2, 1923Warren G. Harding hardly had a successful presidency. It was notable mostly for the Teapot Dome Scandal (one of the biggest money scandals of the last 100 years), a number of salacious affairs and his death a mere 28 months into office. That said, the economic boom of the 1920s kicked into gear under Harding's brief tenure, making his short time in office a good period for the stock market.
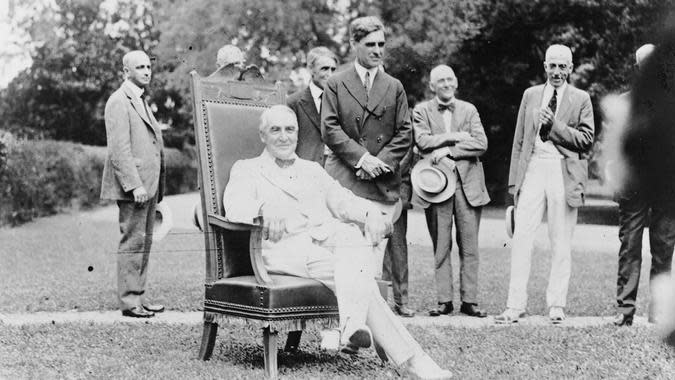
How the Market Performed
Starting Value: 75.11
High Point: 105.38 on March 20, 1923
Low Point: 63.90 on Aug. 24, 1921
Ending Value: 88.20
Performance While in Office: 17.43% increase
After a brief dip to start Harding's presidency, the Dow gained steadily until his death, ultimately adding 17.43%.
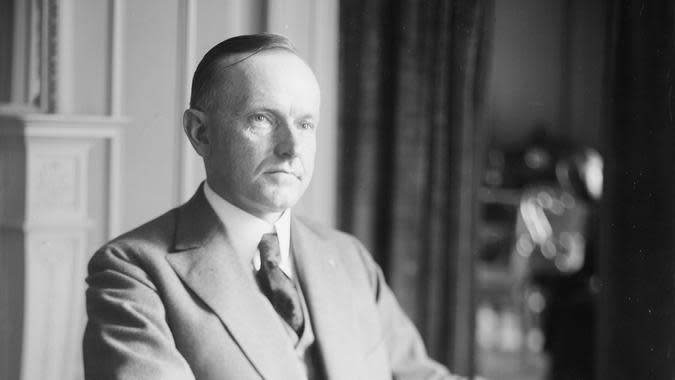
Calvin Coolidge
Time in Office: Aug. 3, 1923 - March 4, 1929Calvin Coolidge was legendarily taciturn despite serving as president for most of the "Roaring Twenties." According to one famous story, a young woman sitting next to "Silent Cal" at a dinner told him that she had made a bet that she could get more than three words out of him, to which Coolidge responded, "You lose."
How the Market Performed
Starting Value: 87.20
High Point: 322.06 on Feb. 5, 1929
Low Point: 85.76 on Oct. 27, 1923
Ending Value: 319.12
Performance While in Office: 265.96% increase
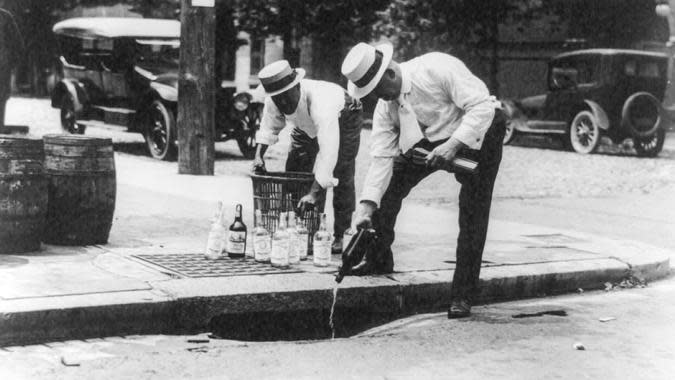
They didn't call them the "Roaring" Twenties for nothing. President Coolidge served during a positively frothy stock market that saw the Dow more than triple in value during his time in office, prompting the phrase "Coolidge prosperity" to describe the economic success of the times. The '20s were also one of the best decades for America's money. Coolidge's 265.96% return is the largest of any U.S. presidency. And thanks to Prohibition he couldn't even have a drink to celebrate...
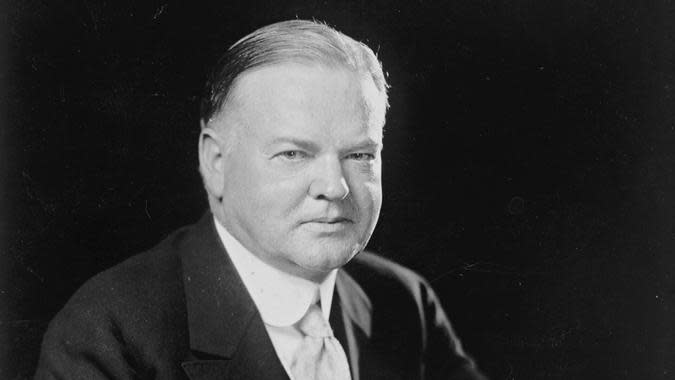
Herbert Hoover
Time in Office: March 4, 1929 - March 4, 1933Herbert Hoover was unlucky enough to take office just as an unprecedented era of wealth and prosperity came screeching to a halt, giving way to the Great Depression. Hoover did serve as the U.S. Secretary of Commerce under the two previous administrations, so it's not as though he was entirely blameless in the situation.
How the Market Performed
Starting Value: 313.86
High Point: 381.17 on Sept. 3, 1929
Low Point: 41.22 on July 8, 1932
Ending Value: 53.84
Performance While in Office: -82.85% decrease
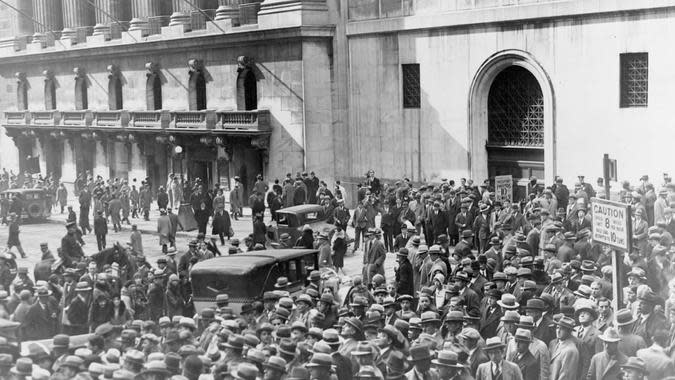
There may be no better example of how the stock market's performance during a presidency is mostly about timing than poor Herbert Hoover. Hoover wasn't president during the wildly irresponsible trading and banking practices that created the 1929 stock market crash. Nonetheless, Black Tuesday rocked the markets less than a year into his presidency, and he wound up overseeing a nearly 83% decline in the Dow while he was in office.
Franklin D. Roosevelt
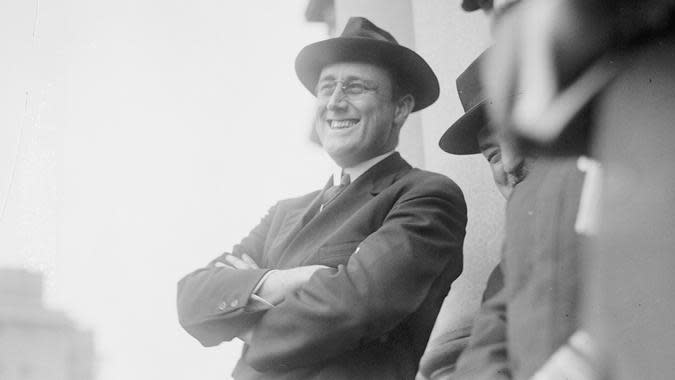
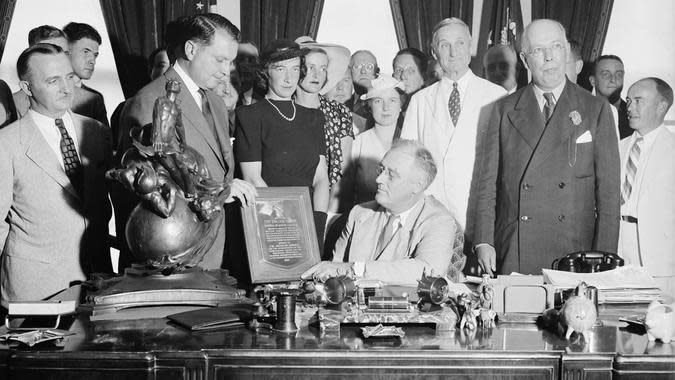
Time in Office: March 4, 1933 - April 12, 1945The New Deal helped start a recovery from the Great Depression that would ultimately be completed by the enormous efforts to expand production during World War II. Roosevelt was immensely unpopular with bankers and other leaders of industry, but the nation experienced incredible economic growth under his presidency, nonetheless.The federal minimum wage was established in 1938 — see what it has been every year since then.
How the Markets Performed
Starting Value: 62.10
High Point: 194.40 on March 10, 1937
Low Point: 55.40 on March 31, 1933
Ending Value: 158.06
Performance While in Office: 154.52% increase
One of the most common pieces of advice you'll see about investing in the stock market is to hold on when things get rocky, because over time stocks usually recover and make gains. FDR's long tenure is a prime example. Despite taking office in the doldrums of the Great Depression, Roosevelt was in office long enough — over 12 years — that the Dow more than recovered, giving him the third-highest total return on this list.

Harry S. Truman
Time in Office: April 12, 1945 - Jan. 20, 1953Truman entered the White House in the aftermath of FDR's death and would oversee the end of World War II and the beginning of the Korean War. He was also president during the massive economic expansion that followed World War II in the United States and helped implement the Marshall Plan to rebuild a war-torn Europe.

How the Markets Performed
Starting Value: 158.48
High Point: 293.79 on Jan. 5, 1953
Low Point: 158.48 on April 12, 1945
Ending Value: 286.97
Performance While in Office: 81.08% increase
Truman was fortunate that the Dow's low point during his presidency fell on the same day he took office. The growth that followed the end of World War II also meant the Dow grew more than 80% under Truman.
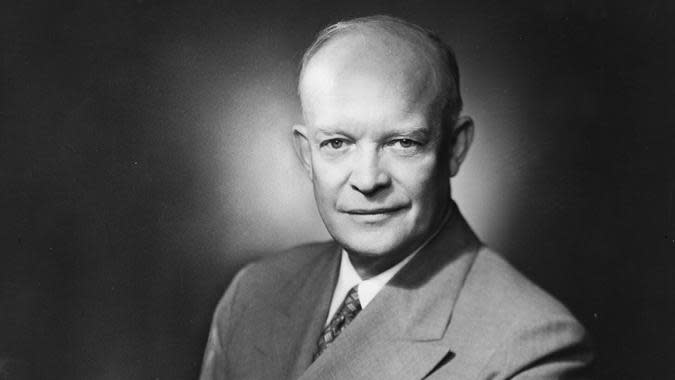
Dwight D. Eisenhower
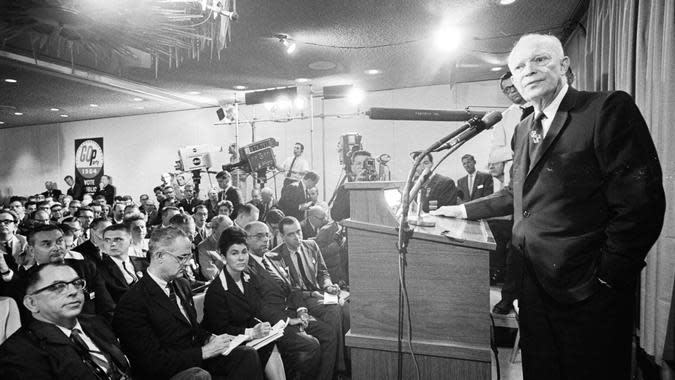
Time in Office: Jan. 20, 1953 - Jan. 20, 1961Dwight D. "Ike" Eisenhower was the Supreme Allied Commander during World War II and served as president for most of the 1950s. He emphasized balanced budgets at home and a strong stance against the Soviet Union.
How the Market Performed
Starting Value: 288
High Point: 685.47 on Jan. 5, 1960
Low Point: 255.49 on Sept. 14, 1953
Ending Value: 632.39
Performance While in Office: 119.58% increase
Eisenhower benefited from consistent stock market growth while president. The Dow's low point came during his first year in office, and its high point came just two weeks before he left the White House. The Dow more than doubled in value under Eisenhower, showing that investors seemed to end up really liking Ike.
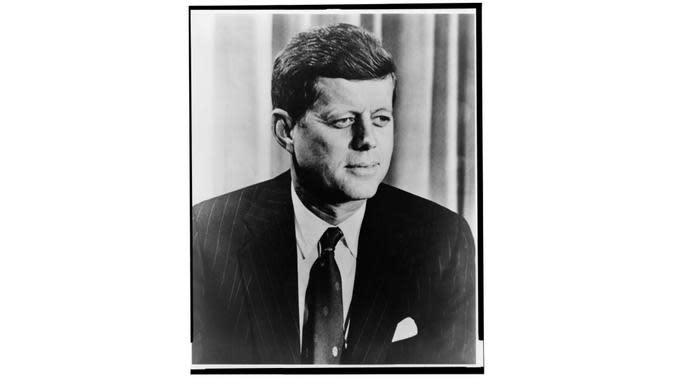
John F. Kennedy
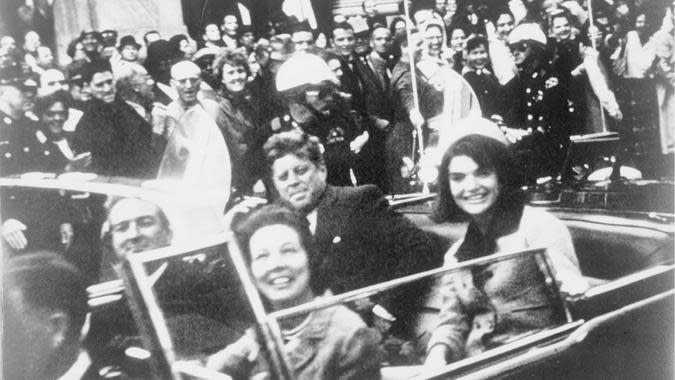
Time in Office: Jan. 20, 1961 - Nov. 22, 1963John F. Kennedy's presidency might have been brief, but he oversaw the dawn of a booming economy. The nation's 4.3 percent average annual GDP growth during JFK's term was the second-highest among 20th-century presidents.The Kennedy family was notoriously wealthy, making JFK one of the wealthiest presidents.
How the Market Performed
Starting Value: 634.37
High Point: 760.50 on Oct. 29, 1963
Low Point: 535.76 on June 26, 1962
Ending Value: 732.65
Performance While in Office: 15.49% increase
The Dow fell 15.5 percent during the first year-and-a-half of Kennedy's presidency. However, it made a strong reversal to hit its high point less than a month before his life was tragically cut short in Dallas. It ended up rising more than 15% during JFK's time in office.
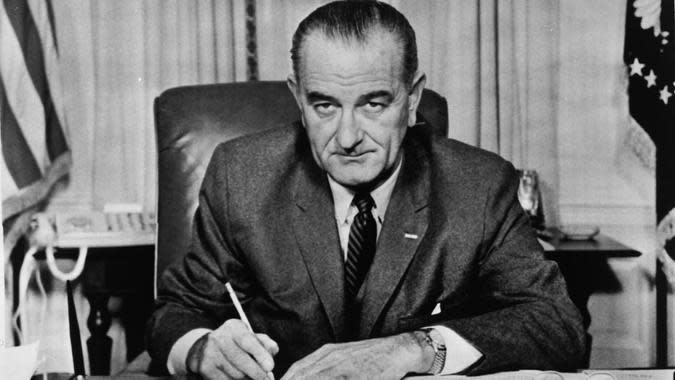
Lyndon B. Johnson
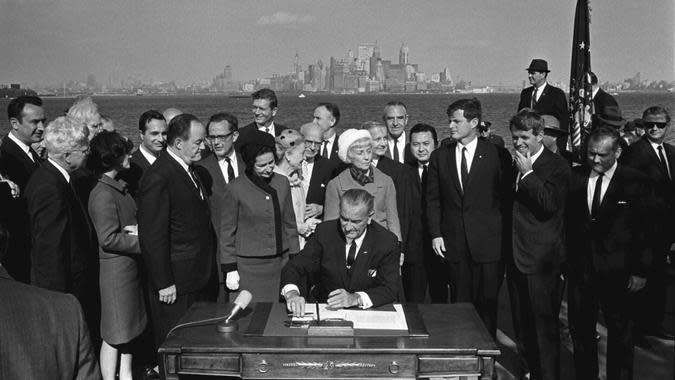
Time in Office: Nov. 22, 1963 - Jan. 20, 1969Johnson may have taken office following a tragedy, but he was president during a period of robust economic growth. The GDP rose an average of 5.3% a year during LBJ's term, the highest of any president since World War II.
How the Markets Performed
Starting Value: 711.49
High Point: 995.15 on Feb. 9, 1966
Low Point: 711.49 on Nov. 22, 1963
Ending Value: 935.54
Performance While in Office: 31.49% increase
Like Truman, Johnson saw the Dow hit the lowest point of his presidency on the day he took office. By the time he left, it marked the fifth straight administration with gains of 15% or more. Considering that the high point came a little over two years into LBJ's tenure, however, his market gains appear to be heavily front-loaded. From early February 1966 to the end of his tenure, the Dow actually declined some 60 points.
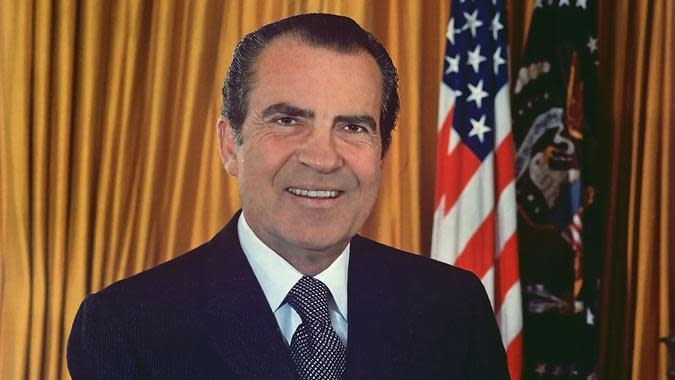
Richard M. Nixon
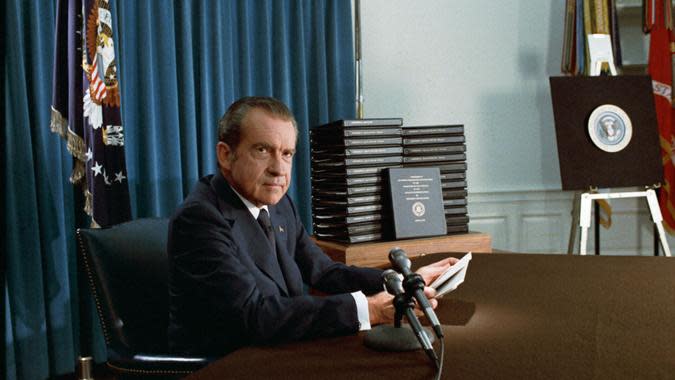
Time in Office: Jan. 20, 1969 - Aug. 9, 1974Nixon's presidency was marred by the way it ended, with the 37th president forced to resign in the wake of the Watergate scandal. He did, however, make considerable strides in foreign policy during his time in office, overseeing the U.S. exit from Vietnam, recognizing the People's Republic of China and signing important treaties with the Soviet Union.
How the Market Performed
Starting Value: 931.25
High Point: 1,051.70 on Jan. 11, 1973
Low Point: 631.16 on May 26, 1970
Ending Value: 784.89
Performance While in Office: -15.72% decrease
Considering that it took only seven trading days for the Dow to go from the 25,000-point milestone to the 26,000-point milestone in 2018, it's notable that it wasn't until the index's 76th year that it first hit the 1,000-point level. Nixon, meanwhile, saw markets slump during his abbreviated second term. His presidency was the first with negative Dow returns since Herbert Hoover.
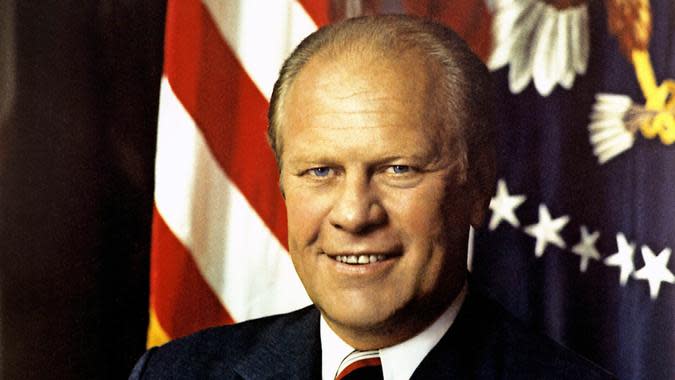
Gerald R. Ford
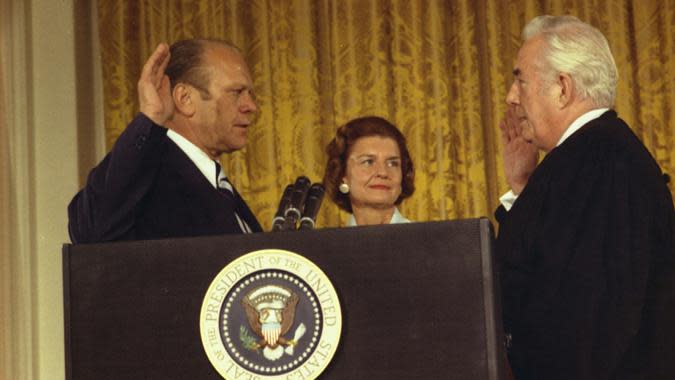
Time in Office: Aug. 9, 1974 - Jan. 20, 1977Gerald Ford took office during an extremely difficult time in American history, following the resignation of Richard Nixon. Ford is also notable for being the only U.S. president never to be on a winning presidential ticket. The candidate for vice president in 1972 was Spiro Agnew, who was forced to resign in October 1973 amid various allegations of corruption. That allowed Ford, then a congressman, to ascend to the vice presidency.
How the Markets Performed
Starting Value: 777.3
High Point: 1,014.69 on Sept. 21, 1976
Low Point: 577.66 on Dec. 6, 1974
Ending Value: 968.67
Performance While in Office: 24.62% increase
The post-Watergate slide in the stock markets hit a bottom a few months after Ford was sworn into office, but it rebounded from there. The Dow rose by almost a quarter during Ford's presidency, even though he was only in office about two-and-a-half years.

James E. Carter
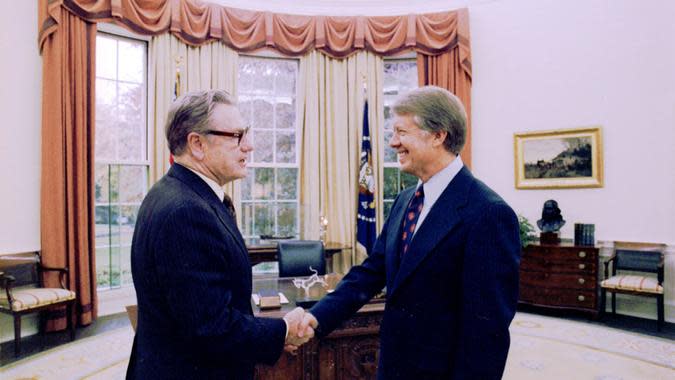
Time in Office: Jan. 20, 1977 - Jan. 20, 1981Carter's presidency coincided with rising energy costs and stagflation. Despite these economic troubles, annual GDP growth under Carter averaged 3.3%, which beat the post-World War II average of 2.9%.
How the Markets Performed
Starting Value: 959.03
High Point: 1,004.69 on Jan. 6, 1981
Low Point: 742.12 on Feb. 28, 1978
Ending Value: 970.99
Performance While in Office: 1.25% increase
The stock market was almost impressive in its stagnancy during Carter's term. It finished just 1.25 percent higher than it started — the smallest change since Taft's 0.56% decline. That small change doesn't tell the whole story, though. The market fell to a bottom in early 1978 before recovering enough to just beat breaking even.
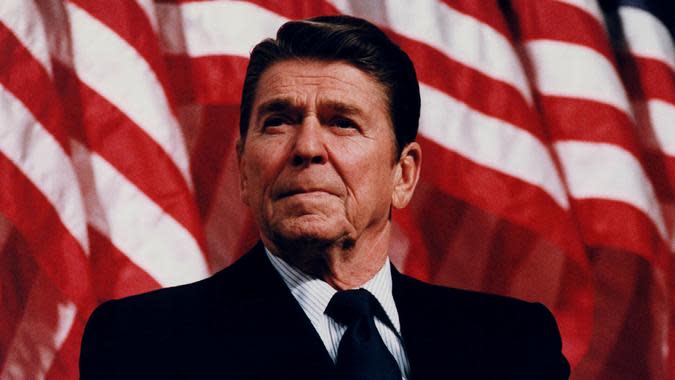
Ronald W. Reagan
Time in Office: Jan. 20, 1981 - Jan. 20, 1989Ronald Reagan was notable for pushing for major tax cuts during his time in office, but he also nearly doubled federal deficits in the process after increasing defense spending by 35% in an effort to force the Soviet Union into capitulation. He outpaced his immediate predecessors in economic growth, though, as the nation's GPD climbed an average of 3.5% a year despite the fact that the economy actually contracted by almost 2% in 1982.
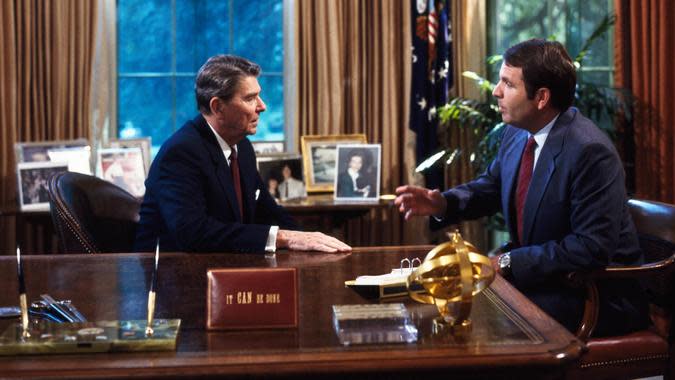
How the Markets Performed
Starting Value: 950.68
High Point: 2,722.42 on Aug. 25, 1987
Low Point: 776.92 on Aug. 12, 1982
Ending Value: 2,239.11
Performance While in Office: 135.53% increase
The Dow first reached the 1,000-point milestone in 1972. It hovered around that level for more than a decade before clearing it for good in December 1982, while Reagan was in office. He saw the Dow more than double under his administration, finishing up 135.53% despite a staggering 508-point drop during the 1987 stock market crash.
George H. W. Bush
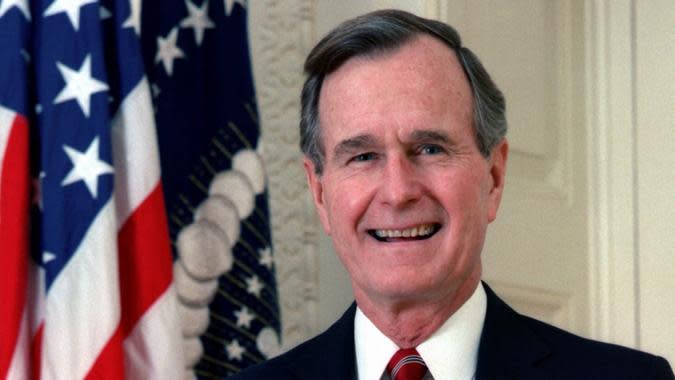
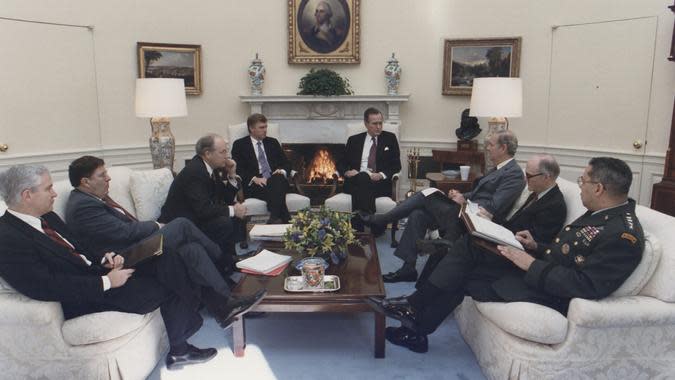
Time in Office: Jan. 20, 1989 - Jan. 20, 1993George H.W. Bush had the misfortune of seeing a recession fall in the middle of his one term in office, hindering economic growth and contributing heavily to his loss in the 1992 presidential election.
How the Markets Performed
Starting Value: 2,235.36
High Point: 3,413.21 on June 1, 1992
Low Point: 2,218.39 on Jan. 23, 1989
Ending Value: 3,255.99
Performance While in Office: 45.66% increase
Considering the weak GDP growth and employment figures that marred much of Bush's time in office, the 45.66% growth in the Dow showed that stock markets seemed to shake off a sluggish economy under his administration.
William J. Clinton
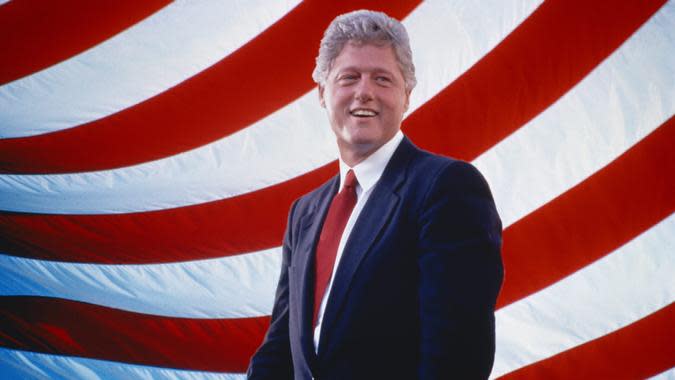
Time in Office: Jan. 20, 1993 - Jan. 20, 2001Taking office in the aftermath of a recession can do wonders for how history perceives your economic record. The country's 3.9% average annual GDP growth during Clinton's term is surpassed only by Kennedy and Johnson since World War II.

How the Markets Performed
Starting Value: 3,241.95
High Point: 11,722.98 on Jan. 14, 2000
Low Point: 3,241.95 on Jan. 20, 1993
Ending Value: 10,587.59
Performance While in Office: 226.58% increase
Clinton oversaw an era that witnessed 226.58% growth in the Dow, blowing past the 5,000- and 10,000-point milestones. He also did what most people cannot by timing the market well. The Dow's low point during Clinton's presidency came on the day of his inauguration and the high point came just a year before he left office.

George W. Bush
Time in Office: Jan. 20, 2001 - Jan. 20, 2009The September 11 attack and the subsequent wars in Iraq and Afghanistan tend to define the second Bush presidency, but weak economic growth also dogged this period. Thanks to those wars, the national debt grew, too. The nation's GDP grew an average of just 2.1% a year over the course of his administration, a figure that was drawn down significantly by the beginning of the Great Recession in 2008.
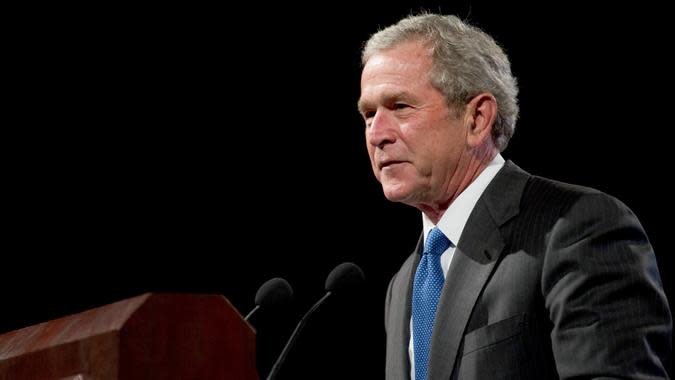
How the Markets Performed
Starting Value: 10,587.59
High Point: 14,164.53 on Oct. 9, 2007
Low Point: 7,286.27 on Oct. 9, 2002
Ending Value: 8,281.22
Performance While in Office: -21.78% decrease
Although the Dow nearly doubled from the lowest to highest points of the second President Bush's time in office, the collapse that followed the housing crisis put the Dow into the red for his tenure. The end of the last year of his administration was especially tough. The Dow had 13 separate days where it lost more than 400 points from mid-September 2008 to the end of the year.
Barack H. Obama
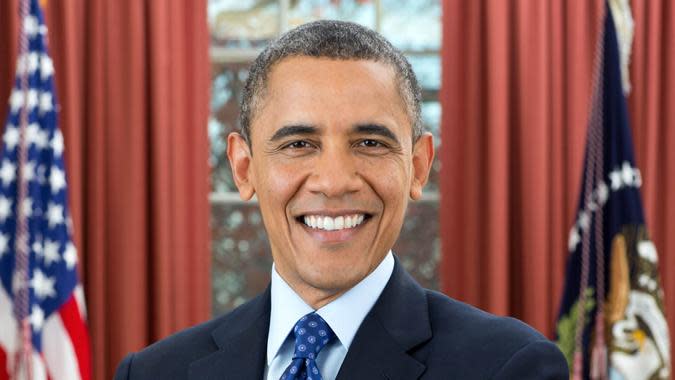
Time in Office: Jan. 20, 2009 - Jan. 20, 2017The devastation of the Great Recession reached its peak during the beginning of the Obama administration, as the nation's GDP contracted by a staggering 2.776% in 2009 alone. Although that figure improved during the rest of Obama's tenure, the annual average growth rate of 1.5% on his watch is the lowest of any president since World War II.
How the Market Performed
Starting Value: 7,949.09
High Point: 19,974.62 on Dec. 20, 2016
Low Point: 6,547.05 on March 9, 2009
Ending Value: 19,732.40
Performance While in Office: 148.23% increase
Obama inherited a stock market in free fall, with the Dow plunging more than 300 points on the day he was inaugurated. However, after bottoming out a couple months later, the sluggish economic recovery didn't seem to hinder the stock market. The Dow more than tripled from its bottom under Obama and finished on the doorstep of the 20,000-point milestone by the time he left office.
Donald J. Trump
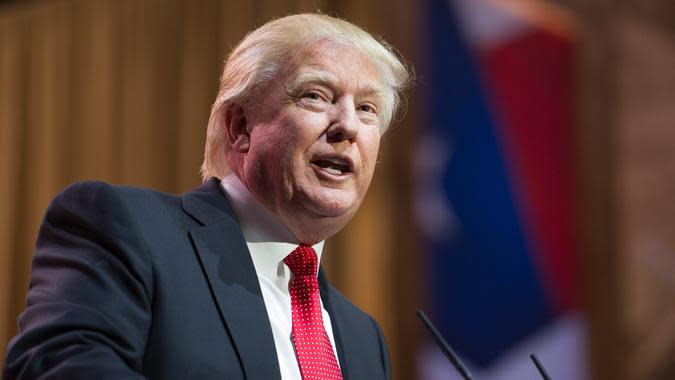
Time in Office: Jan. 20, 2017 - Jan. 20, 2021Trump's major economic policies included the Tax Cuts and Jobs Act and a protracted trade war with China. The GDP was up under Trump, rising 2.3% in 2019 and 2.9% the year before. Hiring numbers were good, too — the unemployment rate decreased throughout Trump's presidency and were at historically low levels for much of 2019.That all shifted In 2020, however, as Trump's economic agenda became— like so much else — defined by the pandemic. Congressional stimulus payments and PPP loans dominated the final year of Trump's term and helped prevent the economy from tumbling even further, which would have likely dragged the stock market down along with it.
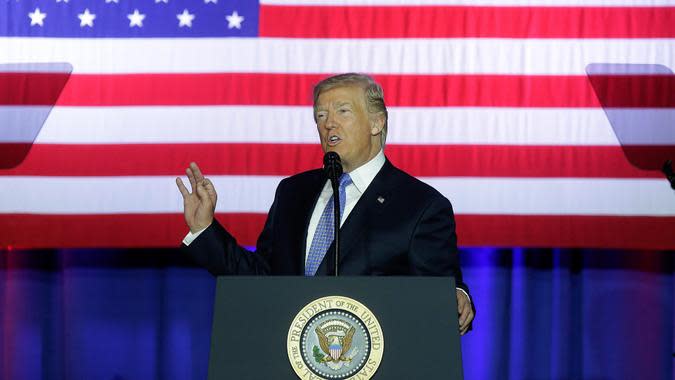
How the Markets Performed
Starting Value: 19,827.25
High Point: 31,223.78 on Jan 14, 2021
Low Point: 18,213.65 on Mar. 23, 2020
Ending Value: 30,930.52
Performance While in Office: 56% increase
The Dow performed remarkably well during most of Trump's presidency. Even after markets were rocked by the coronavirus, high-flying tech stocks managed to lift markets back to the point where they set records. If your fortunes are connected to the stock market, you likely escaped a significant amount of the economic pain of the pandemic.
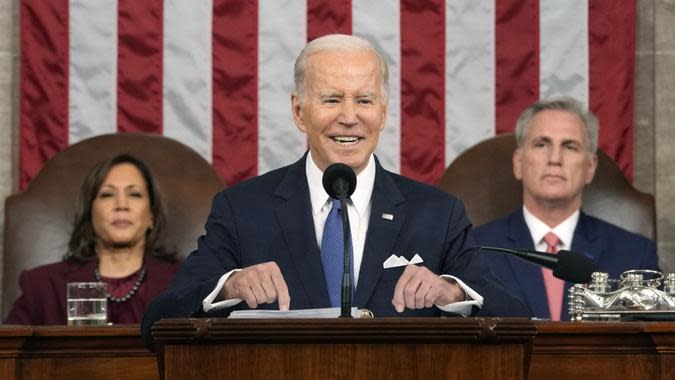
Joseph R. Biden
Time in Office: Jan. 20, 2021 - PresentBiden's passage of the American Rescue Plan helped propel the expansion of the economy as it emerged from the pandemic. However, too much stimulus may have ultimately proven hard for the economy to digest. As of Jan. 2022, the CPI inflation rate had spiked 7.5% on a year-over-year basis, the highest reading in 40 years. In response, the Federal Reserve aggressively raised the federal funds rate from a range of 0%-0.25% to 4.5%-4.75%, with more to come. The combination of factors has pressured businesses and consumers alike and has many predicting a recession in 2023.
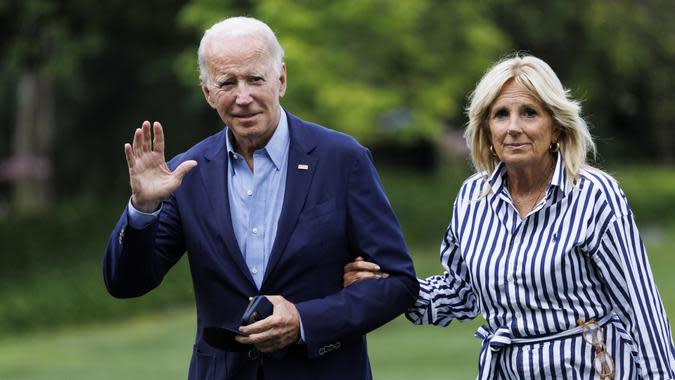
How the Markets Performed
Starting Value: 31,188.38
High Point: 36,952.65 on Jan. 5, 2022
Low Point: 28,660.94 on Oct. 13, 2022
Performance While in Office: 8.67% increase as of Feb. 6, 2023
In Biden's first two years in office, the stock market has both boomed and busted. In 2021, Biden's first year, the S&P 500 returned over 26%, but this was followed by a drop of nearly 20% in 2022. Stocks shot up to begin 2023, but as of February began giving some of those gains back. Net-net, the stock market has returned single digits since Biden took office.More From GOBankingRates7 Florida Cities That Could Be Headed For a Housing Crisis
Do You Have a Tax Question? Ask a Tax Pro
Safeguard Your Retirement From Economic Turbulence
Here's How To Build a 6-Month Emergency Fund
John Csiszar contributed to the reporting for this article.
This article originally appeared on GOBankingRates.com: How the Stock Market Performed Under Each President
