Biggest Boomtowns in Every State

Boomtown. The word sounds like it's describing an explosion -- and in a way, it is. Boomtowns are considered the fastest-growing cities in America due to rapid business and population growth. An example of such a place is Horizon West, Florida, which saw massive five- and eight-year percentage changes in population at 113.72% and 222.30%, respectively. In terms of numbers, the population jumped from 10,093 people in 2010 to 32,530 in 2018. Per capita income also grew from $32,800 to $38,050 over the course of those eight years.
Read: The 50 Cities Best Prepared To Reignite Their Economy and Job Market
See: The 50 Best Cities for Renters
But Horizon West isn't the only boomtown out there. GOBankingRates found one in every state by looking at the one-, five- and eight-year changes in population, owner-occupied housing units and per capita income of more than 1,700 cities. To qualify as a boomtown on this list, cities had to have a population of less than 500,000. So, some of the boomtowns, such as Omaha, Nebraska and New Orleans are fast approaching that 500,000 threshold.
Last updated: July 28, 2021
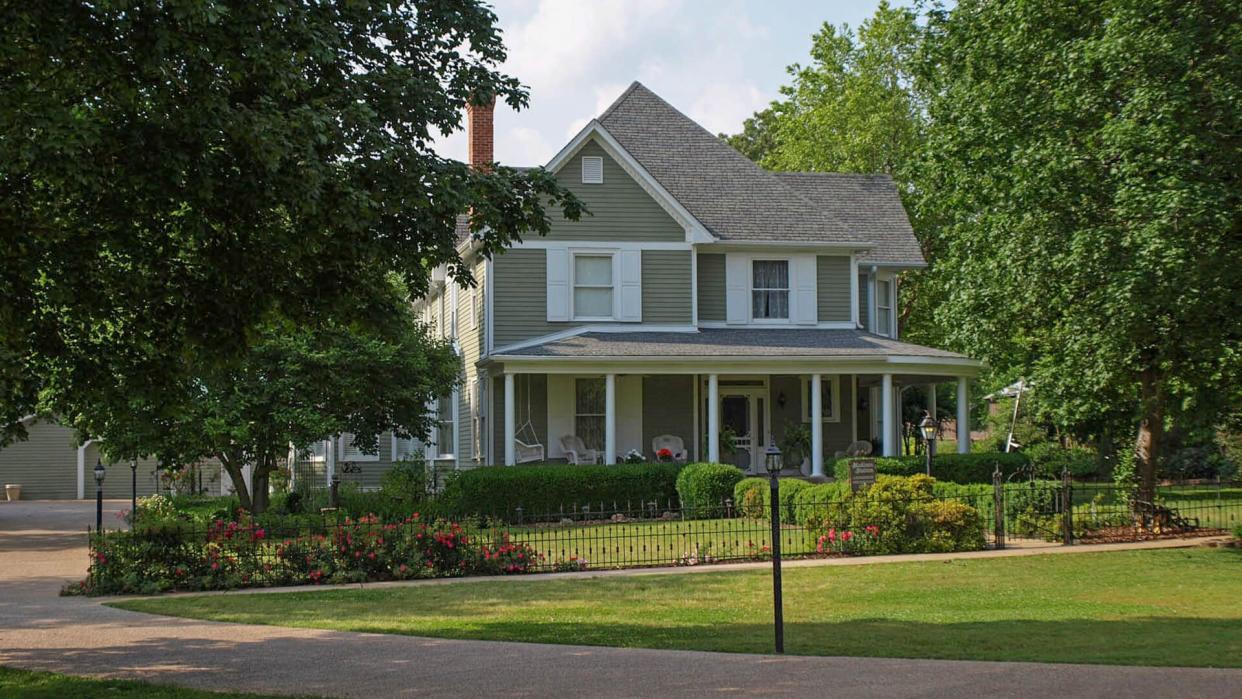
Alabama: Madison
Change in population:
1 year: 2.54%
5 years: 9.61%
8 years: 19.81%
Change in owner-occupied housing units:
1 year: 5.33%
5 years: 9.51%
8 years: 20.16%
Change in per capita income:
1 year: 3.15%
5 years: 9.21%
8 years: 19.58%
See: 8 Insider Tips To Get Rich in Real Estate

Alaska: Anchorage
Change in population:
1 year: -0.71%
5 years: 0.30%
8 years: 4.17%
Change in owner-occupied housing units:
1 year: 1.73%
5 years: 1.70%
8 years: 0.71%
Change in per capita income:
1 year: 2.21%
5 years: 10.01%
8 years: 14.88%
Read More: 50 Cities Where It’s Cheaper To Buy a Home Than Rent
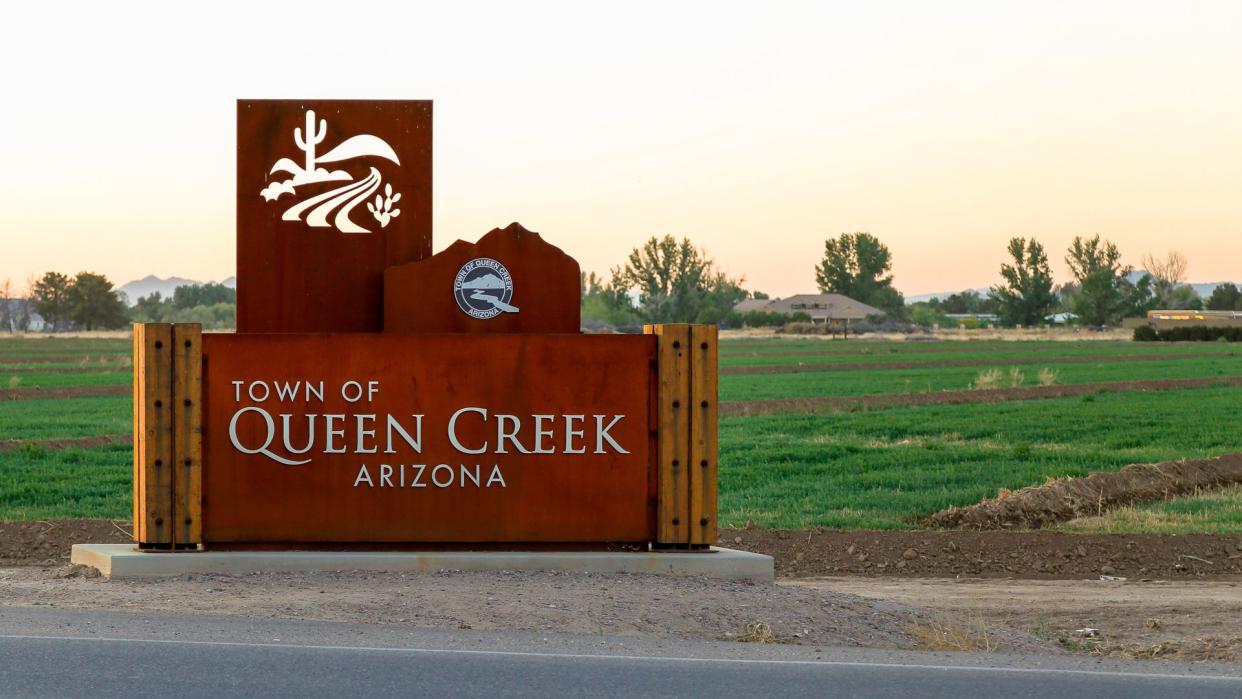
Arizona: Queen Creek
Change in population:
1 year: 8.27%
5 years: 32.94%
8 years: 56.38%
Change in owner-occupied housing units:
1 year: 7.94%
5 years: 43.13%
8 years: 65.54%
Change in per capita income:
1 year: 4.91%
5 years: 15.21%
8 years: 32.13%
Find Out: The Cost To Own a 3-Bedroom Home in Every State

Arkansas: Bentonville
Change in population:
1 year: 5.06%
5 years: 26.19%
8 years: 43.36%
Change in owner-occupied housing units:
1 year: 6.86%
5 years: 19.05%
8 years: 30.94%
Change in per capita income:
1 year: 1.64%
5 years: 19.63%
8 years: 43.57%
Look Here: America’s Best Suburbs for Growing Families

California: Coachella
Change in population:
1 year: 1.05%
5 years: 7.75%
8 years: 17.58%
Change in owner-occupied housing units:
1 year: 18.02%
5 years: 69.27%
8 years: 77.31%
Change in per capita income:
1 year: 12.69%
5 years: 36.60%
8 years: 34.95%
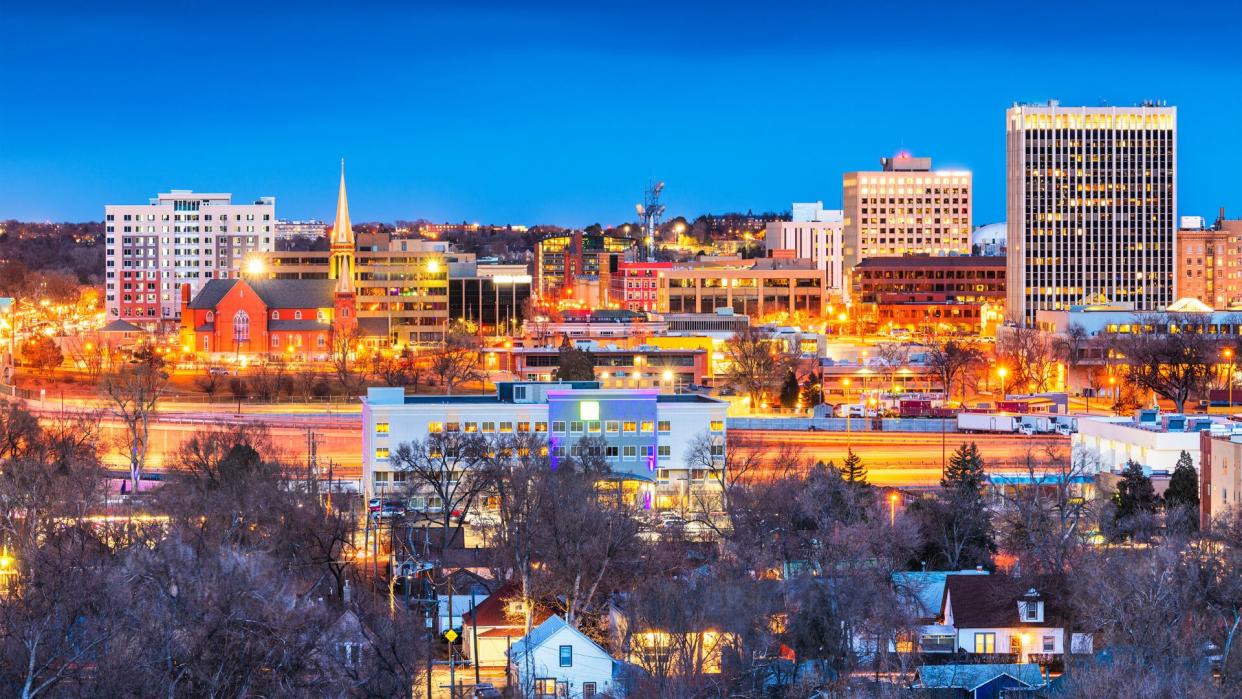
Colorado: Colorado Springs
Change in population:
1 year: 1.67%
5 years: 7.44%
8 years: 13.25%
Change in owner-occupied housing units:
1 year: 2.24%
5 years: 6.44%
8 years: 4.32%
Change in per capita income:
1 year: 3.85%
5 years: 11.96%
8 years: 14.57%

Connecticut: Stamford
Change in population:
1 year: 0.14%
5 years: 4.06%
8 years: 6.72%
Change in owner-occupied housing units:
1 year: -0.66%
5 years: 5.26%
8 years: 0.09%
Change in per capita income:
1 year: 5.39%
5 years: 26.15%
8 years: 23.27%

Delaware: Newark
Change in population:
1 year: 0.33%
5 years: 4.38%
8 years: 7.21%
Change in owner-occupied housing units:
1 year: 5.97%
5 years: 3.56%
8 years: 6.17%
Change in per capita income:
1 year: 4.07%
5 years: 11.15%
8 years: 16.06%

Florida: Horizon West
Change in population:
1 year: 28.25%
5 years: 113.72%
8 years: 222.30%
Change in owner-occupied housing units:
1 year: 22.60%
5 years: 89.81%
8 years: 159.91%
Change in per capita income:
1 year: 8.23%
5 years: 18.56%
8 years: 16.01%
Pictured: Orlando, Florida, is the nearest metropolitan area to Horizon West

Georgia: Chamblee
Change in population:
1 year: 1.11%
5 years: 97.35%
8 years: 194.82%
Change in owner-occupied housing units:
1 year: 7.57%
5 years: 75.74%
8 years: 229.32%
Change in per capita income:
1 year: 10.95%
5 years: 11.58%
8 years: 30.32%
Be In the Action: The Most Affordable Downtowns To Live In Across America

Hawaii: Kahului
Change in population:
1 year: 5.23%
5 years: 22.73%
8 years: 30.75%
Change in owner-occupied housing units:
1 year: 7.36%
5 years: 28.32%
8 years: 19.51%
Change in per capita income:
1 year: 3.96%
5 years: 9.66%
8 years: 16.75%
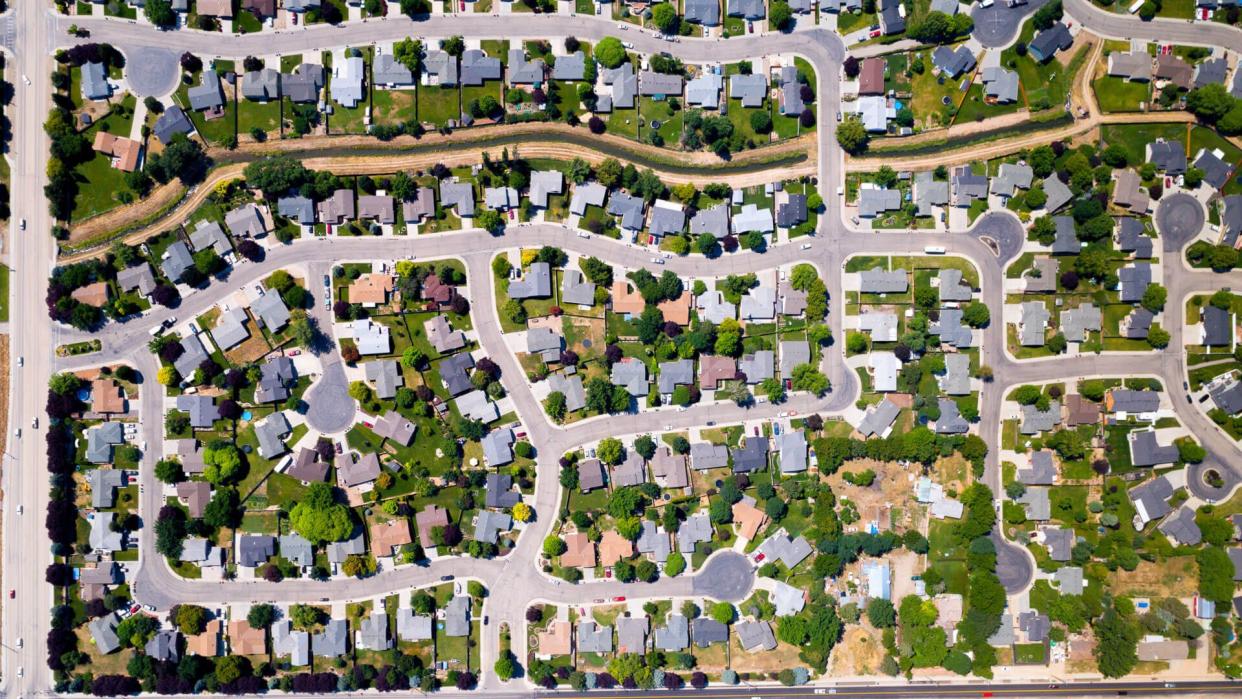
Idaho: Meridian
Change in population:
1 year: 5.54%
5 years: 24.27%
8 years: 40.69%
Change in owner-occupied housing units:
1 year: 5.50%
5 years: 31.81%
8 years: 40.87%
Change in per capita income:
1 year: 9.14%
5 years: 23.54%
8 years: 23.06%
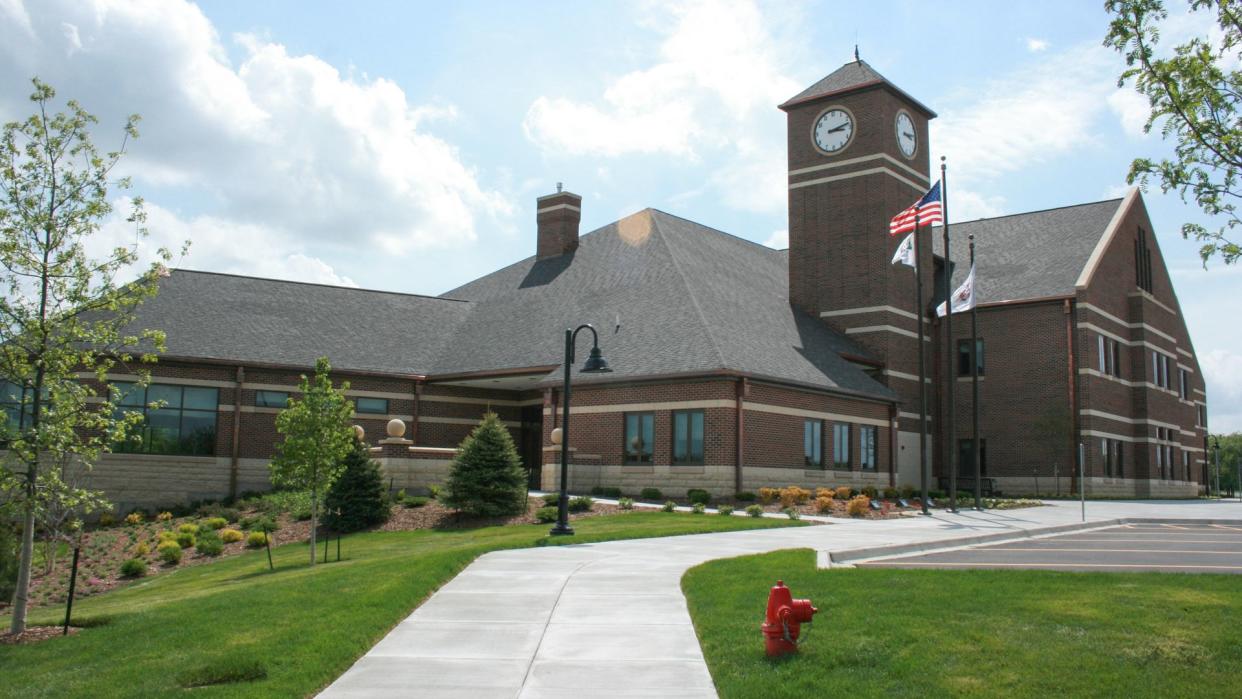
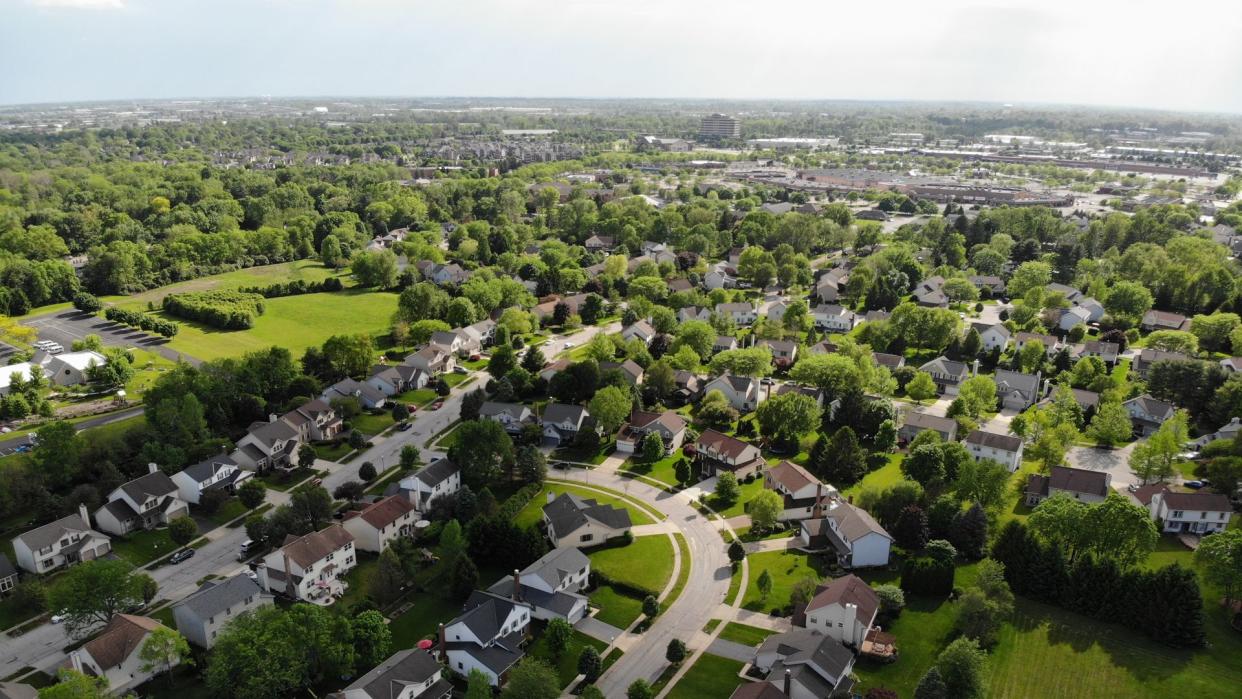
Illinois: Oswego
Change in population:
1 year: 1.85%
5 years: 10.78%
8 years: 24.04%
Change in owner-occupied housing units:
1 year: 4.97%
5 years: 16.80%
8 years: 23.22%
Change in per capita income:
1 year: 4.97%
5 years: 17.85%
8 years: 16.21%

Indiana: West Lafayette
Change in population:
1 year: 4.69%
5 years: 56.70%
8 years: 60.93%
Change in owner-occupied housing units:
1 year: 4.91%
5 years: 18.87%
8 years: 17.18%
Change in per capita income:
1 year: 7.22%
5 years: -8.06%
8 years: -2.39%

Iowa: Ankeny
Change in population:
1 year: 5.18%
5 years: 24.31%
8 years: 40.13%
Change in owner-occupied housing units:
1 year: 7.76%
5 years: 18.38%
8 years: 26.22%
Change in per capita income:
1 year: 6.11%
5 years: 19.83%
8 years: 23.44%

Kansas: Lenexa
Change in population:
1 year: 1.96%
5 years: 8.44%
8 years: 12.66%
Change in owner-occupied housing units:
1 year: 1.31%
5 years: 9.52%
8 years: 7.64%
Change in per capita income:
1 year: 7.63%
5 years: 24.01%
8 years: 20.70%

Kentucky: Lexington-Fayette
Change in population:
1 year: 1.15%
5 years: 5.95%
8 years: 10.65%
Change in owner-occupied housing units:
1 year: 1.97%
5 years: 3.24%
8 years: 2.04%
Change in per capita income:
1 year: 4.14%
5 years: 12.70%
8 years: 16.30%
Inexpensive Living: 35 Cities Where You Can Afford To Live on Less Than $50,000

Louisiana: New Orleans
Change in population:
1 year: 0.38%
5 years: 9.14%
8 years: 31.96%
Change in owner-occupied housing units:
1 year: 0.20%
5 years: 4.08%
8 years: 26.91%
Change in per capita income:
1 year: 3.08%
5 years: 13.88%
8 years: 21.05%

Maine: South Portland
Change in population:
1 year: 0.33%
5 years: 1.76%
8 years: 2.87%
Change in owner-occupied housing units:
1 year: 2.12%
5 years: 4.47%
8 years: -4.40%
Change in per capita income:
1 year: 8.25%
5 years: 21.24%
8 years: 27.23%
Maryland: Pasadena
Change in population:
1 year: 3.11%
5 years: 14.34%
8 years: 27.71%
Change in owner-occupied housing units:
1 year: 6.67%
5 years: 18.08%
8 years: 23.04%
Change in per capita income:
1 year: 5.30%
5 years: 13.55%
8 years: 18.77%

Massachusetts: Cambridge
Change in population:
1 year: 4.30%
5 years: 9.39%
8 years: 11.75%
Change in owner-occupied housing units:
1 year: 3.09%
5 years: 6.61%
8 years: -0.27%
Change in per capita income:
1 year: 4.06%
5 years: 15.25%
8 years: 22.29%

Michigan: Forest Hills
Change in population:
1 year: 1.26%
5 years: 4.41%
8 years: 9.91%
Change in owner-occupied housing units:
1 year: 2.25%
5 years: 6.22%
8 years: 11.83%
Change in per capita income:
1 year: 7.51%
5 years: 13.15%
8 years: 24.09%
Pictured: Grand Rapids, Michigan, is the nearest metropolitan area to Forest Hills

Minnesota: Maple Grove
Change in population:
1 year: 1.77%
5 years: 10.32%
8 years: 17.84%
Change in owner-occupied housing units:
1 year: 3.94%
5 years: 13.56%
8 years: 18.75%
Change in per capita income:
1 year: 4.96%
5 years: 14.09%
8 years: 20.65%

Mississippi: Olive Branch
Change in population:
1 year: 1.91%
5 years: 7.84%
8 years: 15.08%
Change in owner-occupied housing units:
1 year: 4.85%
5 years: 8.96%
8 years: 4.32%
Change in per capita income:
1 year: 3.95%
5 years: 12.41%
8 years: 11.09%
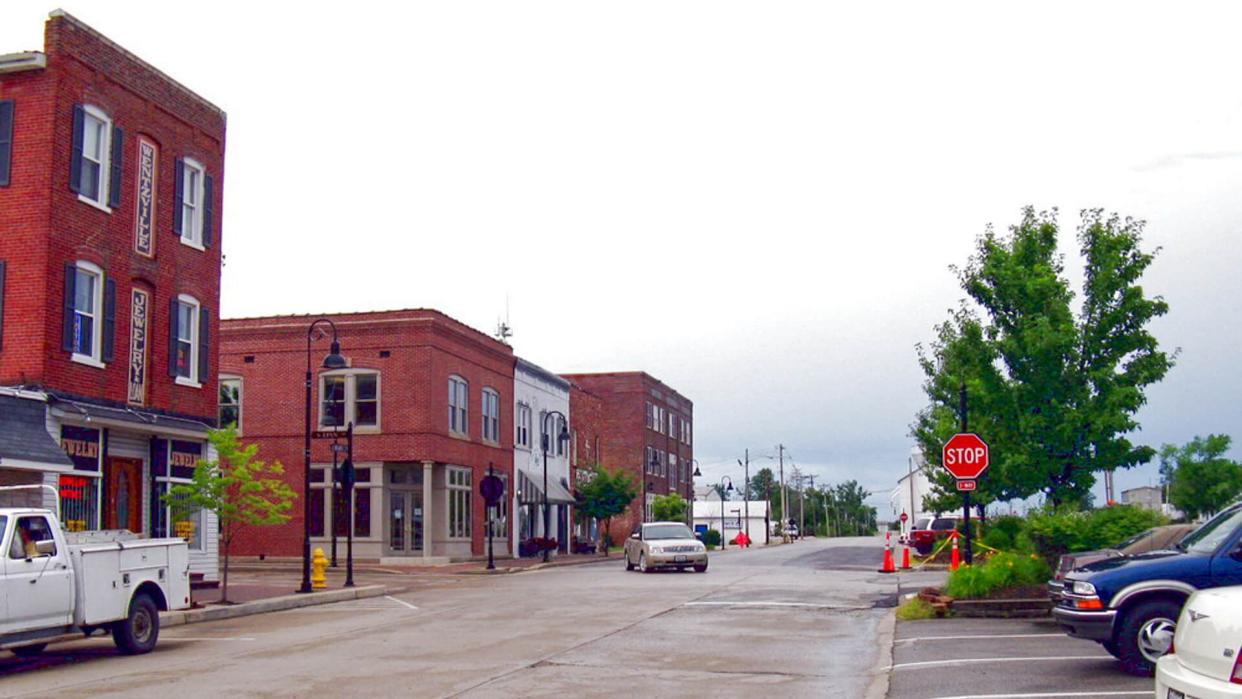
Missouri: Wentzville
Change in population:
1 year: 4.80%
5 years: 23.57%
8 years: 47.66%
Change in owner-occupied housing units:
1 year: 4.35%
5 years: 16.55%
8 years: 39.26%
Change in per capita income:
1 year: 5.30%
5 years: 11.75%
8 years: 16.33%
Find Out: The Richest Small Town in Every State
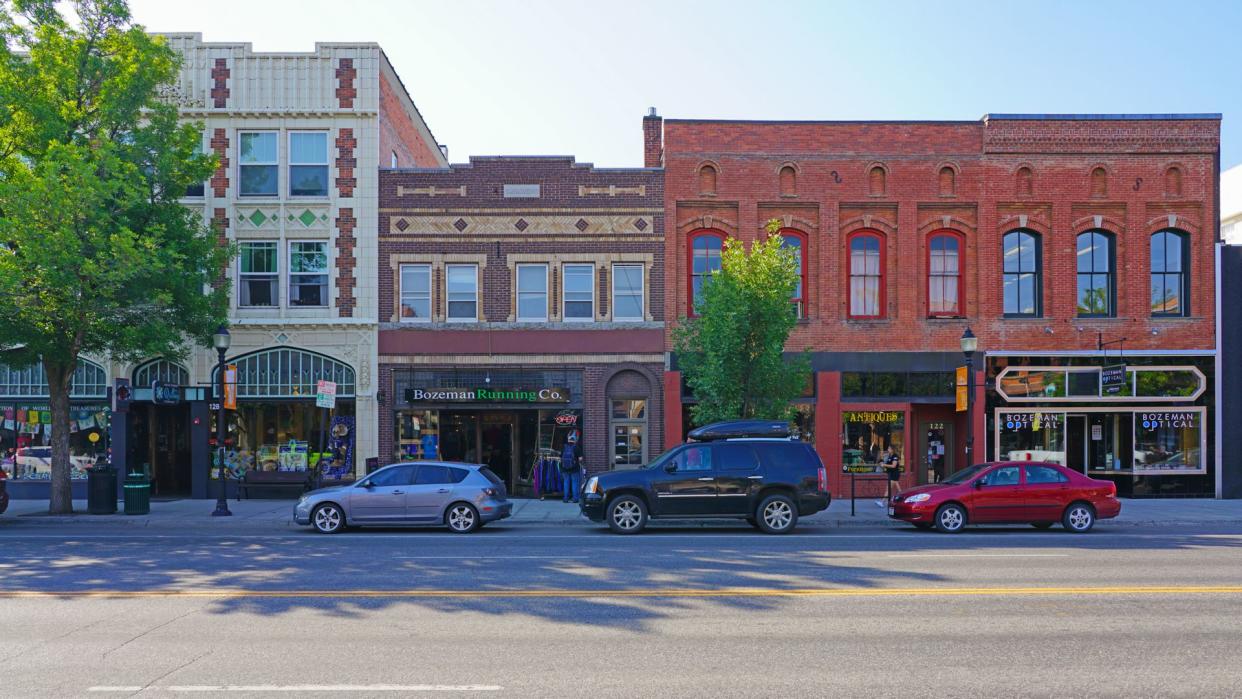
Montana: Bozeman
Change in population:
1 year: 4.61%
5 years: 18.11%
8 years: 23.82%
Change in owner-occupied housing units:
1 year: 2.20%
5 years: 11.71%
8 years: 17.25%
Change in per capita income:
1 year: 4.02%
5 years: 14.93%
8 years: 16.25%

Nebraska: Omaha
Change in population:
1 year: 0.44%
5 years: 10.09%
8 years: 14.18%
Change in owner-occupied housing units:
1 year: 0.77%
5 years: 8.63%
8 years: 8.29%
Change in per capita income:
1 year: 5.21%
5 years: 17.06%
8 years: 21.72%
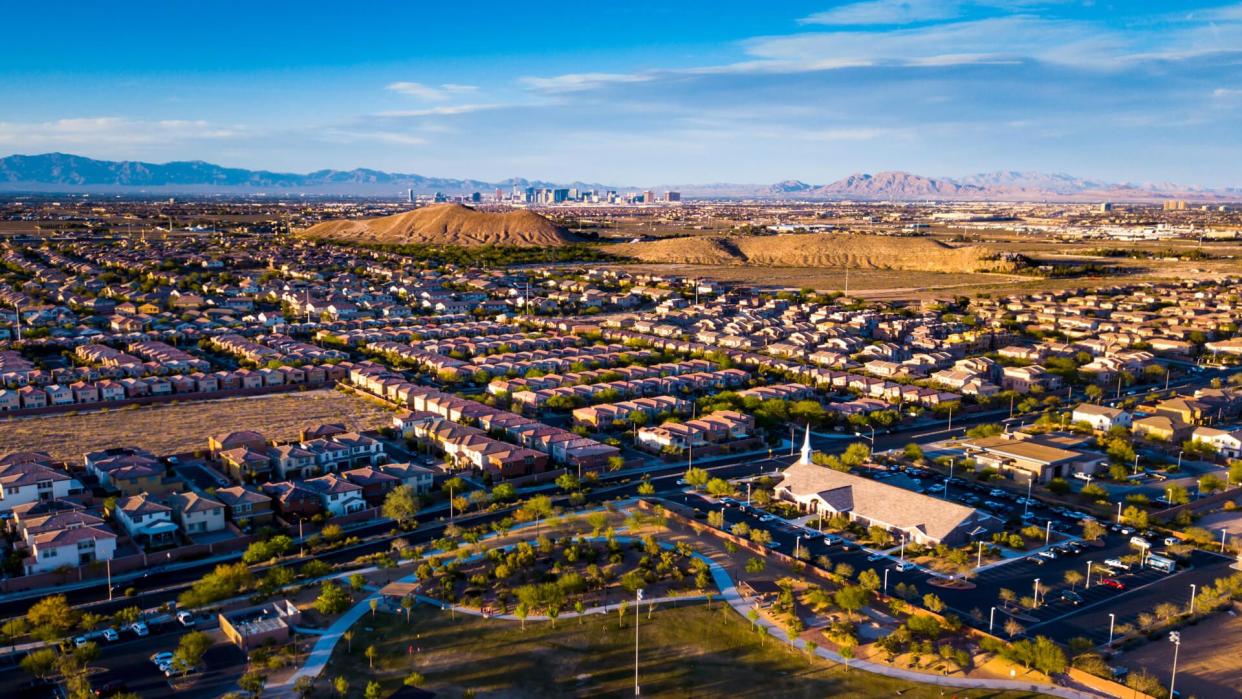
Nevada: Enterprise
Change in population:
1 year: 5.48%
5 years: 38.37%
8 years: 65.07%
Change in owner-occupied housing units:
1 year: 6.20%
5 years: 35.99%
8 years: 45.95%
Change in per capita income:
1 year: 2.96%
5 years: 7.34%
8 years: 3.46%

New Hampshire: Nashua
Change in population:
1 year: 1.10%
5 years: 2.12%
8 years: 1.80%
Change in owner-occupied housing units:
1 year: 3.25%
5 years: -1.42%
8 years: -6.54%
Change in per capita income:
1 year: 8.92%
5 years: 16.92%
8 years: 15.77%

New Jersey: Rahway
Change in population:
1 year: -0.25%
5 years: 6.03%
8 years: 8.91%
Change in owner-occupied housing units:
1 year: 3.25%
5 years: 9.20%
8 years: 7.05%
Change in per capita income:
1 year: 12.66%
5 years: 35.53%
8 years: 31.96%

New Mexico: Santa Fe
Change in population:
1 year: 1.04%
5 years: 21.87%
8 years: 24.06%
Change in owner-occupied housing units:
1 year: -0.69%
5 years: 14.95%
8 years: 12.84%
Change in per capita income:
1 year: 4.55%
5 years: 6.04%
8 years: 4.38%

New York: Uniondale
Change in population:
1 year: 0.73%
5 years: 30.42%
8 years: 29.93%
Change in owner-occupied housing units:
1 year: 1.45%
5 years: 20.48%
8 years: 12.70%
Change in per capita income:
1 year: 4.01%
5 years: 20.55%
8 years: 25.85%
For Your Future: 50 Best and Worst Retirement Towns

North Carolina: Raleigh
Change in population:
1 year: 1.71%
5 years: 10.28%
8 years: 19.45%
Change in owner-occupied housing units:
1 year: 0.96%
5 years: 6.51%
8 years: 10.32%
Change in per capita income:
1 year: 5.07%
5 years: 21.02%
8 years: 22.59%

North Dakota: West Fargo
Change in population:
1 year: 4.02%
5 years: 27.41%
8 years: 44.21%
Change in owner-occupied housing units:
1 year: 3.11%
5 years: 22.25%
8 years: 33.57%
Change in per capita income:
1 year: 8.27%
5 years: 30.78%
8 years: 43.54%
Ohio: Hilliard
Change in population:
1 year: 3.72%
5 years: 20.02%
8 years: 29.67%
Change in owner-occupied housing units:
1 year: 2.01%
5 years: 19.07%
8 years: 29.71%
Change in per capita income:
1 year: 3.51%
5 years: 21.95%
8 years: 29.56%

Oklahoma: Owasso
Change in population:
1 year: 2.92%
5 years: 16.65%
8 years: 32.49%
Change in owner-occupied housing units:
1 year: 2.01%
5 years: 22.01%
8 years: 27.14%
Change in per capita income:
1 year: 2.79%
5 years: 14.31%
8 years: 16.11%
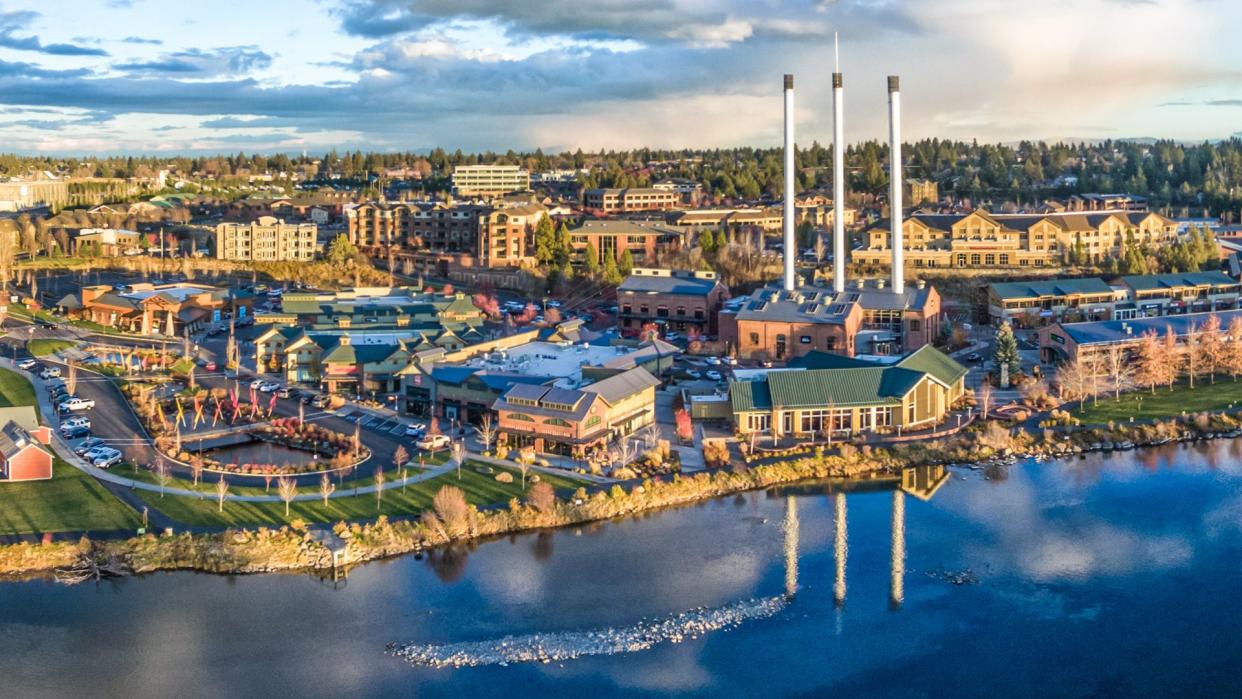
Oregon: Bend
Change in population:
1 year: 3.82%
5 years: 15.84%
8 years: 21.76%
Change in owner-occupied housing units:
1 year: 6.87%
5 years: 18.02%
8 years: 16.24%
Change in per capita income:
1 year: 8.62%
5 years: 23.16%
8 years: 23.70%

Pennsylvania: Plum
Change in population:
1 year: -0.31%
5 years: 0.17%
8 years: 1.69%
Change in owner-occupied housing units:
1 year: 1.14%
5 years: 6.23%
8 years: 10.30%
Change in per capita income:
1 year: 7.45%
5 years: 22.24%
8 years: 25.37%
Pictured: Pittsburgh is the nearest metropolitan area to Plum

Rhode Island: Cranston
Change in population:
1 year: 0.27%
5 years: 0.90%
8 years: 0.76%
Change in owner-occupied housing units:
1 year: 2.34%
5 years: 4.05%
8 years: 0.12%
Change in per capita income:
1 year: 3.25%
5 years: 11.50%
8 years: 17.59%

South Carolina: Mount Pleasant
Change in population:
1 year: 3.77%
5 years: 19.35%
8 years: 30.36%
Change in owner-occupied housing units:
1 year: 2.98%
5 years: 16.80%
8 years: 25.10%
Change in per capita income:
1 year: 8.74%
5 years: 32.82%
8 years: 32.42%
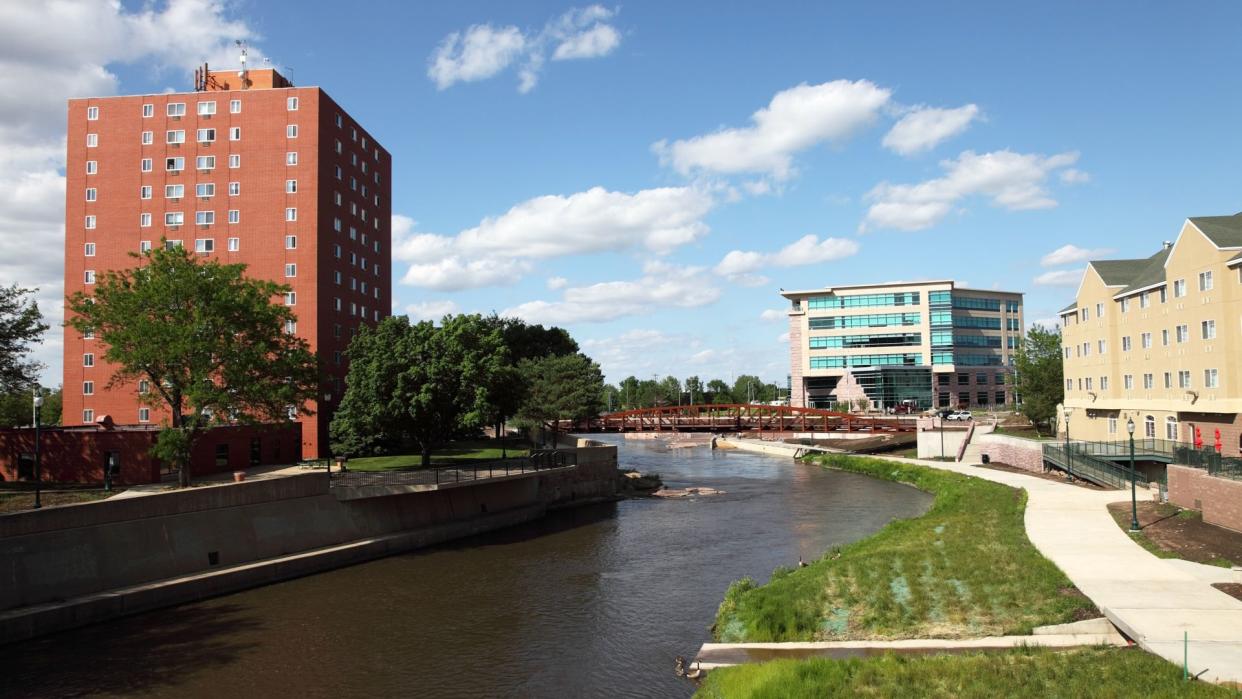
South Dakota: Sioux Falls
Change in population:
1 year: 2.20%
5 years: 10.45%
8 years: 17.00%
Change in owner-occupied housing units:
1 year: 1.41%
5 years: 10.85%
8 years: 15.26%
Change in per capita income:
1 year: 2.06%
5 years: 15.40%
8 years: 15.06%
Take a Look: 25 Cities Where the Middle Class Is Thriving
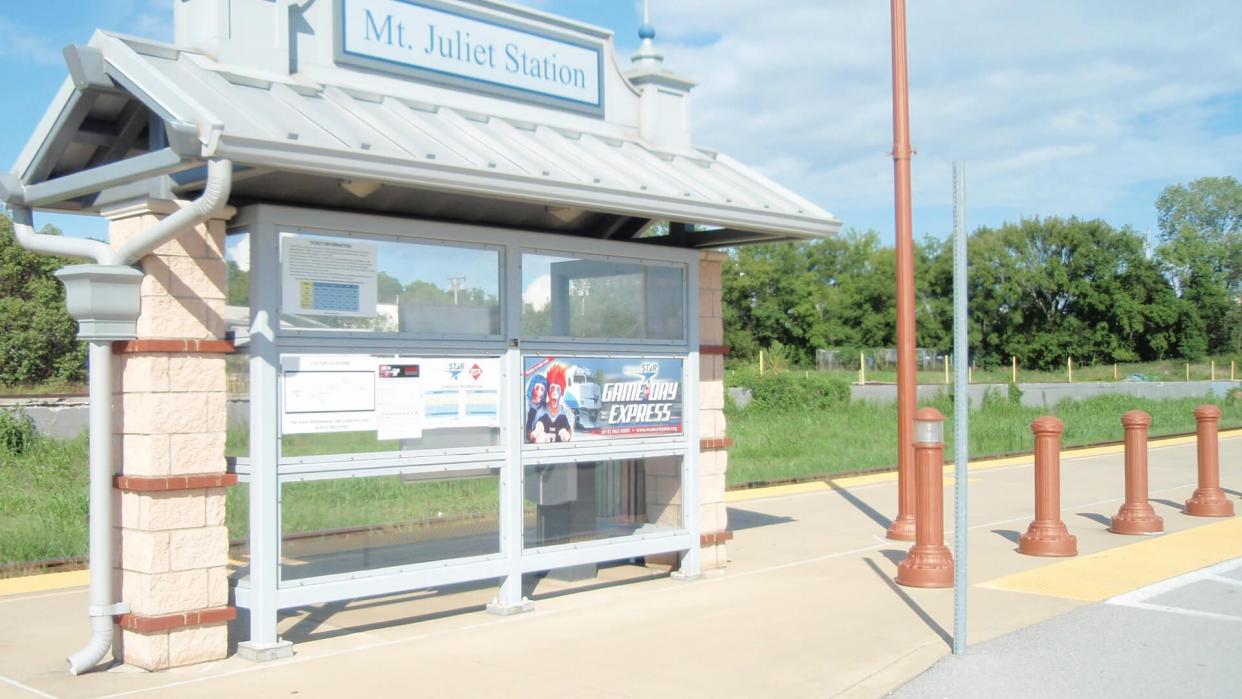
Tennessee: Mount Juliet
Change in population:
1 year: 4.73%
5 years: 27.57%
8 years: 50.00%
Change in owner-occupied housing units:
1 year: 4.45%
5 years: 24.33%
8 years: 38.96%
Change in per capita income:
1 year: 4.21%
5 years: 17.61%
8 years: 19.40%

Texas: Sugar Land
Change in population:
1 year: 36.02%
5 years: 46.35%
8 years: 55.34%
Change in owner-occupied housing units:
1 year: 36.92%
5 years: 47.55%
8 years: 58.43%
Change in per capita income:
1 year: 2.32%
5 years: 16.19%
8 years: 25.05%
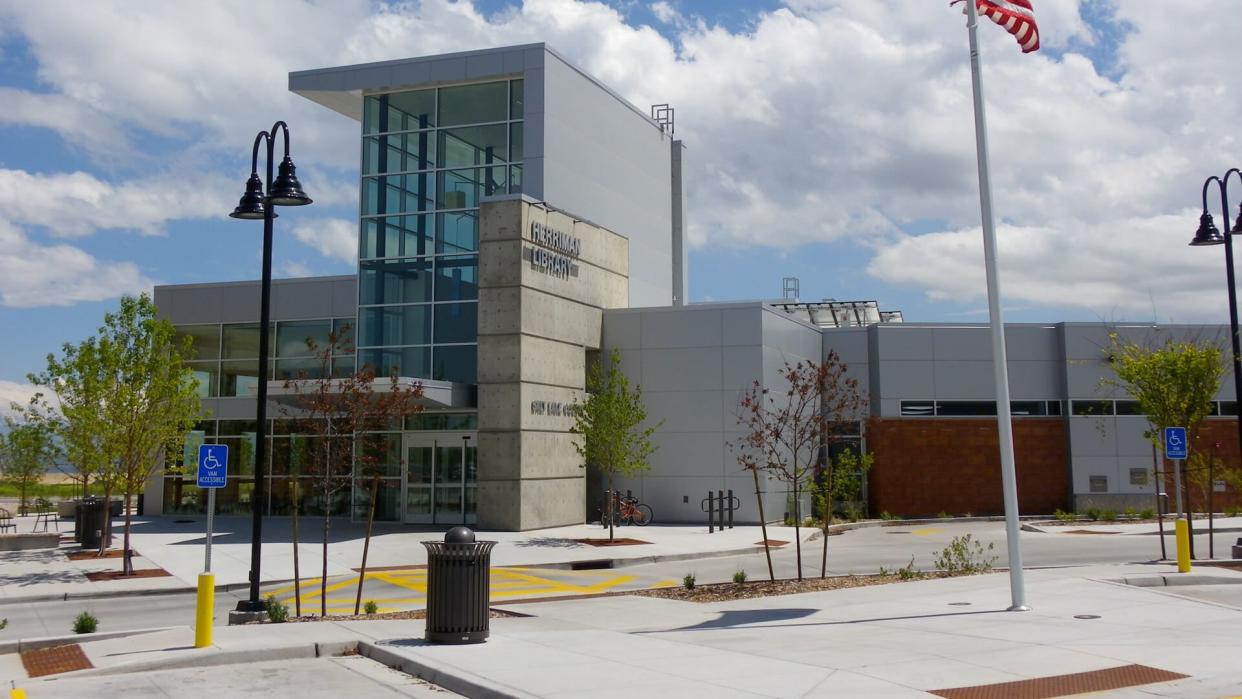
Utah: Herriman
Change in population:
1 year: 11.48%
5 years: 52.18%
8 years: 94.46%
Change in owner-occupied housing units:
1 year: 18.51%
5 years: 66.07%
8 years: 78.86%
Change in per capita income:
1 year: 8.11%
5 years: 34.32%
8 years: 30.04%

Vermont: Burlington
Change in population:
1 year: 0.14%
5 years: 0.43%
8 years: 1.38%
Change in owner-occupied housing units:
1 year: -1.80%
5 years: -7.94%
8 years: -9.72%
Change in per capita income:
1 year: 4.21%
5 years: 6.54%
8 years: 12.82%
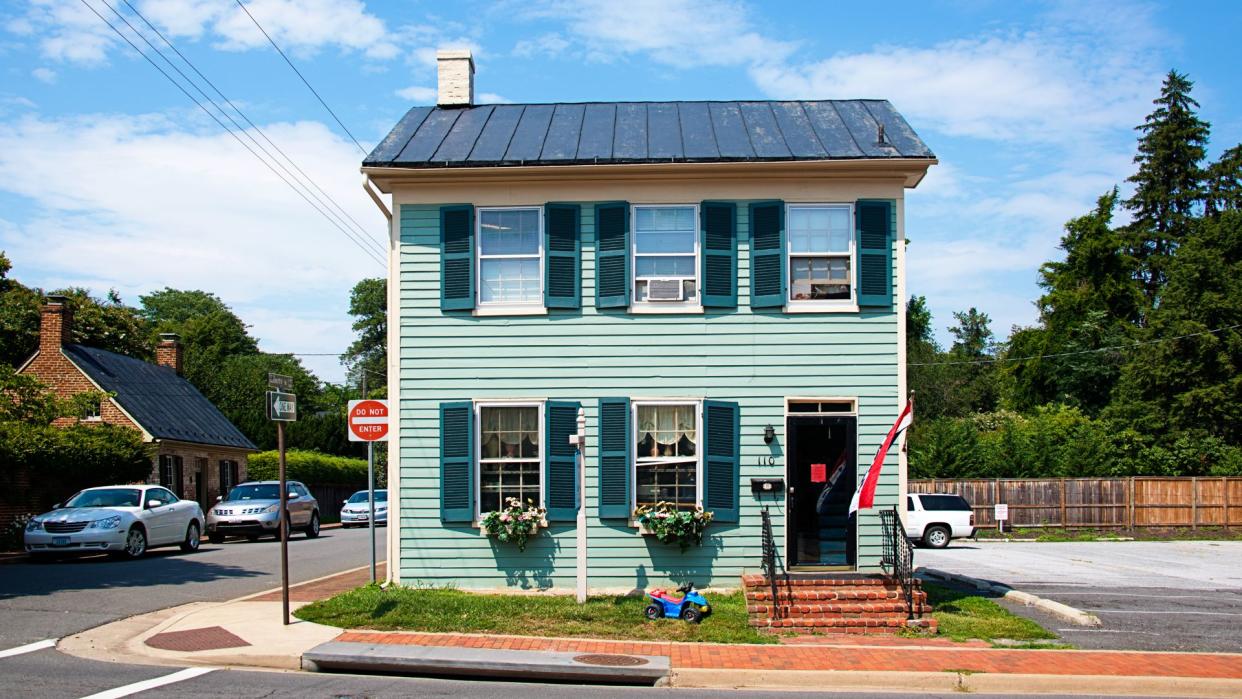
Virginia: Leesburg
Change in population:
1 year: 2.18%
5 years: 16.84%
8 years: 28.03%
Change in owner-occupied housing units:
1 year: 3.60%
5 years: 26.56%
8 years: 20.97%
Change in per capita income:
1 year: 8.40%
5 years: 21.32%
8 years: 23.09%

Washington: Sammamish
Change in population:
1 year: 1.86%
5 years: 34.09%
8 years: 47.78%
Change in owner-occupied housing units:
1 year: 1.17%
5 years: 33.38%
8 years: 44.24%
Change in per capita income:
1 year: 7.11%
5 years: 18.24%
8 years: 26.96%

West Virginia: Morgantown
Change in population:
1 year: 1.46%
5 years: 2.35%
8 years: 5.03%
Change in owner-occupied housing units:
1 year: 3.32%
5 years: 13.93%
8 years: 16.07%
Change in per capita income:
1 year: 7.53%
5 years: 29.20%
8 years: 51.48%

Wisconsin: Fitchburg
Change in population:
1 year: 2.89%
5 years: 12.11%
8 years: 17.40%
Change in owner-occupied housing units:
1 year: 5.05%
5 years: 16.61%
8 years: 18.48%
Change in per capita income:
1 year: 11.35%
5 years: 19.34%
8 years: 16.73%
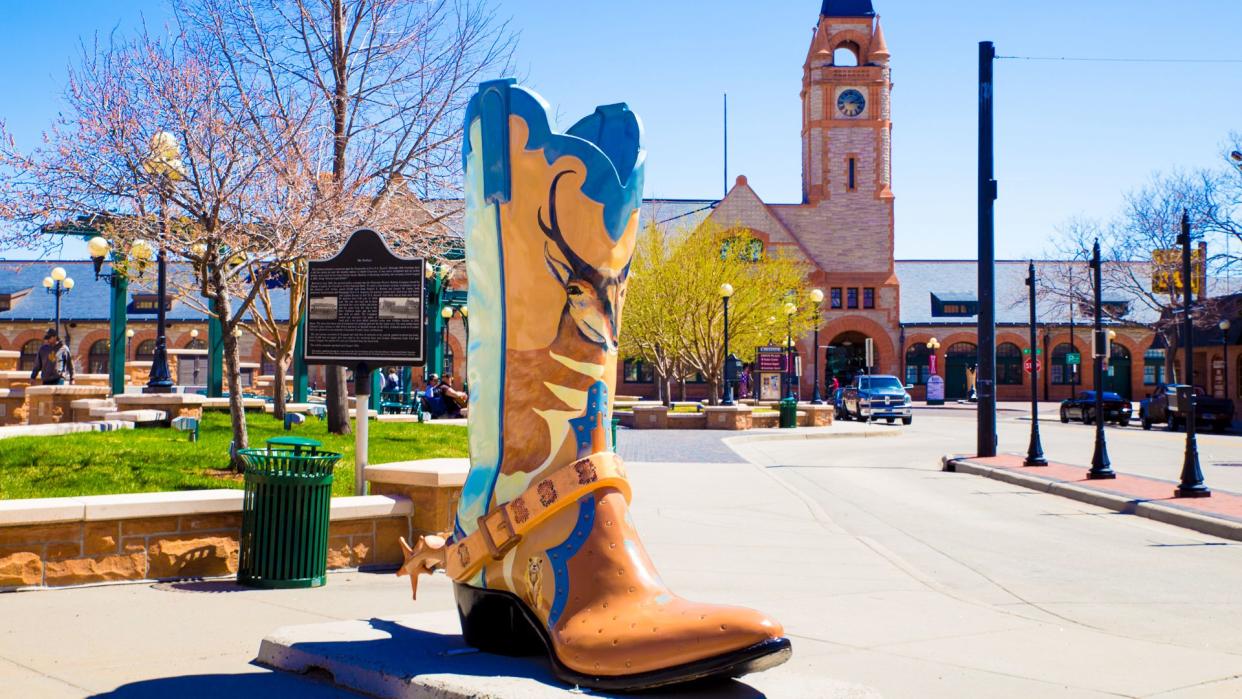
Wyoming: Cheyenne
Change in population:
1 year: 0.41%
5 years: 4.49%
8 years: 9.16%
Change in owner-occupied housing units:
1 year: 2.66%
5 years: 15.53%
8 years: 13.75%
Change in per capita income:
1 year: 4.12%
5 years: 20.14%
8 years: 22.84%

Biggest Boomtowns in Every State: Insights
It's not presently clear how the coronavirus pandemic and ensuing recession might change the population trends observed here, at least in the long term. Will the boomtowns of today become the ghost towns of tomorrow? Or will the things drawing people to these places only be amplified more by the massive changes shifting below the sands? The simple fact is that however much these cities are growing now and have in the recent past, these sort of migration trends change over time.
So if you're thinking you want to find the next boomtown and get in before it really takes off, your chances might still be good. After all, the next boomtown is just a population explosion away.
More From GOBankingRates
Chris Jennings and Erica Corbin contributed to the reporting for this article.
Methodology: GOBankingRates determined the biggest boomtowns in every state by analyzing 1,722 U.S. cities with populations of under 500,000 but above 25,000 as sourced from the 2018 American Community Survey and evaluated them by the following criteria: (1) one-year change in total population by percentage; (2) one-year change in total population by number of people; (3) five-year change in total population by percentage; (4) five-year change in total population by number of people; (5) eight-year change in total population by percentage; (6) eight-year change in total population by number of people; (6) one-year change in amount of occupied housing units by percentage; (7) one-year change in amount of occupied housing units by number of units; (8) five-year change in amount of occupied housing units by percentage; (9) five-year change in amount of occupied housing units by number of units; (10) eight-year change in amount of occupied housing units by percentage; (11) eight-year change in amount of occupied housing units by number of units; (12) one-year change in amount of owner-occupied homes by percentage; (13) one-year change in amount of owner-occupied homes by number of homes; (14) five-year change in amount of owner-occupied homes by percentage; (15) five-year change in amount of owner-occupied homes by number of homes; (16) eight-year change in amount of owner-occupied homes by percentage; (17) eight-year change in amount of owner-occupied homes by number of homes; (18) one-year change in per capita income by percentage; (19) one-year change in per capita income by dollars; (20) five-year change in per capita income by percentage; (21) five-year change in per capita income by dollars; (22) eight-year change in per capita income by percentage; and (23) eight-year change in per capita income by dollars. All data was sourced from the 2018, 2017, 2013 and 2010 American Community Surveys from the U.S. Census Bureau. All factors were scored, added together and cities then ranked, with the best-scoring city being the biggest boomtown in the state. All data was gathered and is up to date as of July 6, 2020.
This article originally appeared on GOBankingRates.com: Biggest Boomtowns in Every State
