These Are the 15 Best Cities for Gen Z To Live Well on a Budget

Generation Z is coming of age. The oldest members of this generation, born from 1997 to 2012, are now in their mid-20s and striking out on their own. As they move out of their parents' homes and into the real world, the opportunity awaits for them to choose the city where they want to live.
Discover: How Gen Z Plans To Avoid Student Loans
Find Out: Surprising Ways Gen Z and Millennials Are Worlds Apart Financially
Of course, that decision largely could be influenced by the college they attend or the job they get. But members of Gen Z would be smart to consider cities where they can live well on a budget so they can get ahead financially -- and not have to rely on support from their parents as many millennials have.
To help Gen Zers find the best places to live, GOBankingRates analyzed the 100 largest U.S. cities based on several criteria. The study considered the population of 18- to 24-year-olds in those cities to determine whether they would be desirable places to live for young adults. In addition, the average cost to rent a one-bedroom apartment, plus the average price of groceries, healthcare, utilities and transportation were examined. GOBankingRates added up the cost of those necessities then subtracted that amount from $35,578 -- the mean after-tax income of Americans ages 25 and younger -- to see how much money would be left over each month after covering costs in those cities.
Find Out: The World's 20 Richest Millennials
Each factor was scored, with median rent weighted triple, population and percentage of population ages 18 to 24 weighted double, leftover income weighted double and livability weighted double. The higher the score, the less affordable and desirable a city was.
Some clear trends emerged. For the most part, the analysis revealed that cities in the South and Midwest tend to be where Gen Zers can save more money on monthly expenses.
Check out the best places for members of the Z generations to live without breaking the bank.

15. Baton Rouge, Louisiana
Percentage of population 18-24: 17.6%
Median monthly rent: $800
Annual cost of groceries: $2,614.08
Annual cost of healthcare: $1,466.21
Annual cost of transportation: $4,388.05
Annual cost of utilities: $1,982.90
Annual cost of necessities: $20,051
Money left over after necessities: $15,527
Livability: 63
Learn More: 35 Surprising Cities With Low Costs of Living

14. Corpus Christi, Texas
Percentage of population 18-24: 10.3%
Median monthly rent: $850
Annual cost of groceries: $2,545.50
Annual cost of healthcare: $1,526.61
Annual cost of transportation: $3,139.38
Annual cost of utilities: $2,257.56
Annual cost of necessities: $19,669
Money left over after necessities: $15,909
Livability: 74
Keep Reading: These Are the 50 Best Cities for Renters

13. Columbia, South Carolina
Percentage of population 18-24: 26.5%
Median monthly rent: $949
Annual cost of groceries: $2,633.28
Annual cost of healthcare: $1,617.21
Annual cost of transportation: $3,009.40
Annual cost of utilities: $2,431.74
Annual cost of necessities: $21,080
Money left over after necessities: $14,498
Livability: 60
State to State: From Alabama to Wyoming: The Cost of Living Across America

12. San Antonio, Texas
Percentage of population 18-24: 10.6%
Median monthly rent: $950
Annual cost of groceries: $2,507.10
Annual cost of healthcare: $1,408.83
Annual cost of transportation: $3,911.43
Annual cost of utilities: $2,119.12
Annual cost of necessities: $21,346
Money left over after necessities: $14,232
Livability: 77
Check Out: How Far a $100,000 Salary Goes in America's 50 Largest Cities

11. Columbus, Ohio
Percentage of population 18-24: 11.5%
Median monthly rent: $860
Annual cost of groceries: $2,710.08
Annual cost of healthcare: $1,307.66
Annual cost of transportation: $3,549.04
Annual cost of utilities: $2,279.89
Annual cost of necessities: $20,167
Money left over after necessities: $15,411
Livability: 76

10. Toledo, Ohio
Percentage of population 18-24: 10.6%
Median monthly rent: $595
Annual cost of groceries: $2,476.93
Annual cost of healthcare: $1,306.15
Annual cost of transportation: $3,320.58
Annual cost of utilities: $2,170.48
Annual cost of necessities: $16,414
Money left over after necessities: $19,164
Livability: 63

9. Tallahassee, Florida
Percentage of population 18-24: 28.9%
Median monthly rent: $800
Annual cost of groceries: $2,655.22
Annual cost of healthcare: $1,810.49
Annual cost of transportation: $3,462.38
Annual cost of utilities: $2,393.78
Annual cost of necessities: $19,922
Money left over after necessities: $15,656
Livability: 63

8. Tucson, Arizona
Percentage of population 18-24: 15.4%
Median monthly rent: $730
Annual cost of groceries: $2,619.57
Annual cost of healthcare: $1,230.65
Annual cost of transportation: $3,805.07
Annual cost of utilities: $2,219.60
Annual cost of necessities: $18,635
Money left over after necessities: $16,943
Livability: 64

7. Knoxville, Tennessee
Percentage of population 18-24: 17.6%
Median monthly rent: $840
Annual cost of groceries: $2,666.20
Annual cost of healthcare: $1,445.07
Annual cost of transportation: $3,222.10
Annual cost of utilities: $2,134.75
Annual cost of necessities: $19,548
Money left over after necessities: $16,030
Livability: 71
Invest Your Extra Money: How To Buy Stocks Online

6. Lincoln, Nebraska
Percentage of population 18-24: 16%
Median monthly rent: $790
Annual cost of groceries: $2,671.68
Annual cost of healthcare: $1,879.95
Annual cost of transportation: $2,993.64
Annual cost of utilities: $2,061.06
Annual cost of necessities: $19,086
Money left over after necessities: $16,492
Livability: 81
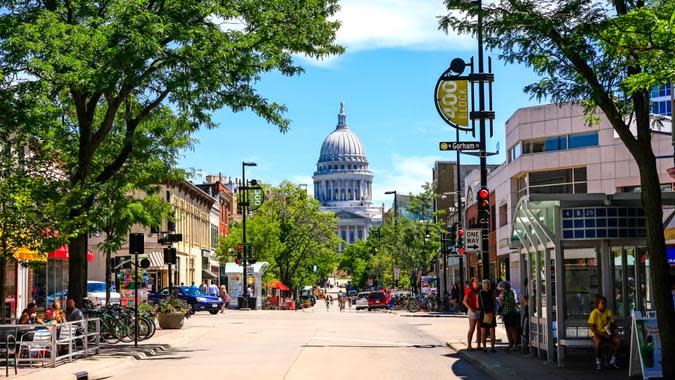
5. Madison, Wisconsin
Percentage of population 18-24: 21.3%
Median monthly rent: $1,070
Annual cost of groceries: $2,685.40
Annual cost of healthcare: $1,303.13
Annual cost of transportation: $3,379.66
Annual cost of utilities: $2,400.48
Annual cost of necessities: $22,609
Money left over after necessities: $12,969
Livability: 75

4. Lexington, Kentucky
Percentage of population 18-24: 14.2%
Median monthly rent: $760
Annual cost of groceries: $2,688.14
Annual cost of healthcare: $1,355.98
Annual cost of transportation: $3,446.63
Annual cost of utilities: $2,029.80
Annual cost of necessities: $18,641
Money left over after necessities: $16,937
Livability: 76

3. El Paso, Texas
Percentage of population 18-24: 11.1%
Median monthly rent: $710
Annual cost of groceries: $2,523.56
Annual cost of healthcare: $1,309.17
Annual cost of transportation: $3,619.94
Annual cost of utilities: $2,168.24
Annual cost of necessities: $18,141
Money left over after necessities: $17,437
Livability: 78

2. Lubbock, Texas
Percentage of population 18-24: 18.9%
Median monthly rent: $650
Annual cost of groceries: $2,520.82
Annual cost of healthcare: $1,582.48
Annual cost of transportation: $2,879.41
Annual cost of utilities: $2,087.86
Annual cost of necessities: $16,871
Money left over after necessities: $18,707
Livability: 74

1. Fort Wayne, Indiana
Percentage of population 18-24: 10%
Median monthly rent: $629
Annual cost of groceries: $2,507.10
Annual cost of healthcare: $1,203.47
Annual cost of transportation: $3,210.29
Annual cost of utilities: $2,025.33
Annual cost of necessities: $16,494
Money left over after necessities: $19,084
Livability: 80
More From GOBankingRates
Social Security Schedule: When the First COLA Checks Will Arrive in January 2022
5 Easy Things You Can Do To Start Preparing For Retirement Now
Cameron Huddleston contributed to the reporting for this article.
Methodology: GOBankingRates determined the best cities for Gen Z to live well on a budget by analyzing the 100 largest cities in the U.S. along the following criteria: (1) population aged 18 to 24 years old, sourced from the U.S. Census Bureau's 2019 American Community Survey; 18- to 24 year-olds were used to be representative of Gen. Z based on Pew Research's age ranges for Gen. Z -- ages 24 and under; (2) percentage of the population aged 18 to 24 years old, sourced from the Census Bureau's 2019 American Community Survey; (3) average rent, based on Zumper and ApartmentList.com's median monthly rent from January to February 2021; itemized costs of living for necessities, sourced from Sperling's Best Places, such as (4) groceries cost of living; (5) healthcare cost of living; (6) utilities cost of living; (7) transportation cost of living; (8) amount of income leftover after paying for necessary costs of living, which is the sum of rent, groceries, healthcare, utilities and transportation subtracted from $35,578, the mean after-tax income of Americans ages 25 and under, according to the Bureau of Labor Statistics' Consumer Expenditure Survey; and (9) livability scores, sourced from AreaVibes. Each factor was scored, with average rent weighted triple, population and percentage of population aged 18 to 24 weighted double, leftover income weighted double and livability weighted double. All data compiled on Feb. 16, 2021.
This article originally appeared on GOBankingRates.com: These Are the 15 Best Cities for Gen Z To Live Well on a Budget
