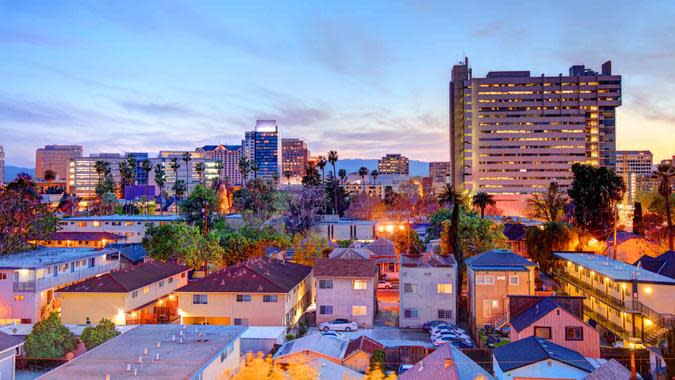
What a Comfortable Retirement Will Cost You in 61 of the Largest US Cities

There are a few reasons why planning for a comfortable retirement has become extra difficult in recent years, among them the wide shift away from pension plans and the rising cost of living. Because of persistent hurdles, many working Americans aren’t feeling so confident about the prospect of retirement. According to a 2023 Gallup poll, non-retired Americans’ expectations for a comfortable retirement were the most pessimistic they had been since 2012, dropping 10 percentage points since 2021.
Explore More: 16 Best Places To Retire in the US That Feel Like Europe
Try This: 4 Genius Things All Wealthy People Do With Their Money
Rather than feel negative about your eventual retirement, you might want to take a proactive and aggressive approach. To best plan for a comfortable retirement, you need to consider not only how you will live in retirement, but where you will live. Note that every big city differs to some degree, in terms of cost of living expenses.
GOBankingRates conducted research to determine how much you’ll need for a comfortable retirement in 61 of the largest cities in the U.S. To accomplish this, GOBankingRates found the most populated 100 cities, as sourced from the U.S. Census American Community Survey. For each city, we factored in a number of data points, including the population aged 65 and over, average household retirement income, cost of living, livability index and the average rental cost. The cost of living indexes were multiplied by the national average expenditure costs for retired residents to find the average expenditure cost for each city, then the average rental cost was added to the average expenditure cost to find the total cost of living for each city.
Only cities with a livability index of 75 and over were considered. Cities are ranked here from least to most expensive, according to the annual cost of living.

Fort Wayne, Indiana
Percentage of population aged 65 and over: 14.7%
Household average retirement income: $23,152
Livability index: 83
Average monthly expenditures cost: $1,738
Average rent cost: $1,174
Total cost of living monthly: $2,912
Total cost of living annually: $34,940
Find Out: 8 States To Move to If You Don’t Want To Pay Taxes on Social Security
Learn More: Here’s the Average Amount Retiree Households Spend in a Year

Oklahoma City
Percentage of population aged 65 and over: 13.1%
Household average retirement income: $30,088
Livability index: 81
Average monthly expenditures cost: $1,850
Average rent cost: $1,261
Total cost of living monthly: $3,111
Total cost of living annually: $37,328
For You: Passive Income Experts: 4 Passive Income Opportunities for Retirees To Generate Wealth

Lexington, Kentucky
Percentage of population aged 65 and over: 14.2%
Household average retirement income: $38,804
Livability index: 86
Average monthly expenditures cost: $1,779
Average rent cost: $1,360
Total cost of living monthly: $3,139
Total cost of living annually: $37,668
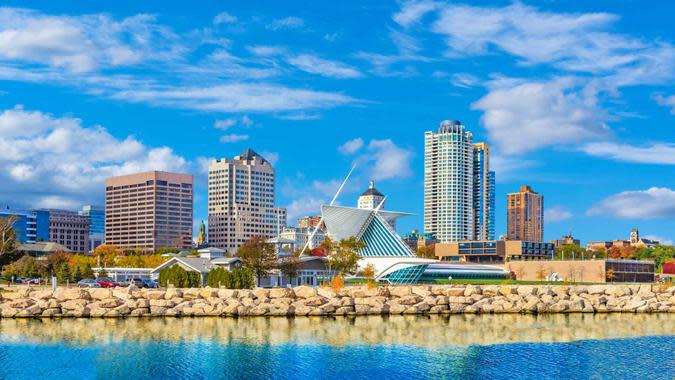
Milwaukee
Percentage of population aged 65 and over: 11.3%
Household average retirement income: $28,253
Livability index: 78
Average monthly expenditures cost: $1,863
Average rent cost: $1,294
Total cost of living monthly: $3,157
Total cost of living annually: $37,883

Indianapolis
Percentage of population aged 65 and over: 12.8%
Household average retirement income: $27,344
Livability index: 77
Average monthly expenditures cost: $1,803
Average rent cost: $1,376
Total cost of living monthly: $3,179
Total cost of living annually: $38,154

Kansas City, Missouri
Percentage of population aged 65 and over: 13.9%
Household average retirement income: $28,311
Livability index: 77
Average monthly expenditures cost: $1,827
Average rent cost: $1,361
Total cost of living monthly: $3,188
Total cost of living annually: $38,250
Be Aware: Social Security 2024: 6 Changes That Impact Your Benefits

San Antonio
Percentage of population aged 65 and over: 12.8%
Household average retirement income: $33,391
Livability index: 80
Average monthly expenditures cost: $1,790
Average rent cost: $1,417
Total cost of living monthly: $3,208
Total cost of living annually: $38,493

Cincinnati
Percentage of population aged 65 and over:12.9%
Household average retirement income: $38,980
Livability index: 80
Average monthly expenditures cost: $1,805
Average rent cost: $1,415
Total cost of living monthly: $3,219
Total cost of living annually: $38,630

Corpus Christie, Texas
Percentage of population aged 65 and over: 14.5%
Household average retirement income: $32,766
Livability index: 80
Average monthly expenditures cost: $1,830
Average rent cost: $1,404
Total cost of living monthly: $3,233
Total cost of living annually: $38,802

El Paso, Texas
Percentage of population aged 65 and over: 13.5%
Household average retirement income: $30,891
Livability index: 81
Average monthly expenditures cost: $1,716
Average rent cost: $1,521
Total cost of living monthly: $3,237
Total cost of living annually: $38,840
Check Out: Retirement Planning: Here’s How Much Money You Actually Need To Age in Place

Columbus, Ohio
Percentage of population aged 65 and over: 10.7%
Household average retirement income: $35,257
Livability index: 79
Average monthly expenditures cost: $1,821
Average rent cost: $1,422
Total cost of living monthly: $3,243
Total cost of living annually: $38,913
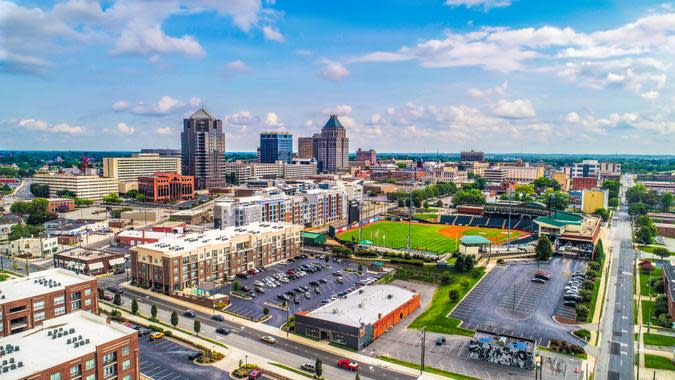
Greensboro, North Carolina
Percentage of population aged 65 and over: 13.6%
Household average retirement income: $34,578
Livability index: 83
Average monthly expenditures cost: $1,813
Average rent cost: $1,452
Total cost of living monthly: $3,265
Total cost of living annually: $39,179

Spokane, Washington
Percentage of population aged 65 and over: 16.2%
Household average retirement income: $28,416
Livability index: 80
Average monthly expenditures cost: $1,792
Average rent cost: $1,482
Total cost of living monthly: $3,273
Total cost of living annually: $39,282

Lubbock, Texas
Percentage of population aged 65 and over: 12.3%
Household average retirement income: $31,083
Livability index: 78
Average monthly expenditures cost: $1,906
Average rent cost: $1,381
Total cost of living monthly: $3,287
Total cost of living annually: $39,449
Trending Now: Net Worth for Baby Boomers: How To Tell Whether You’re Poor, Middle Class, Upper Middle Class or Rich
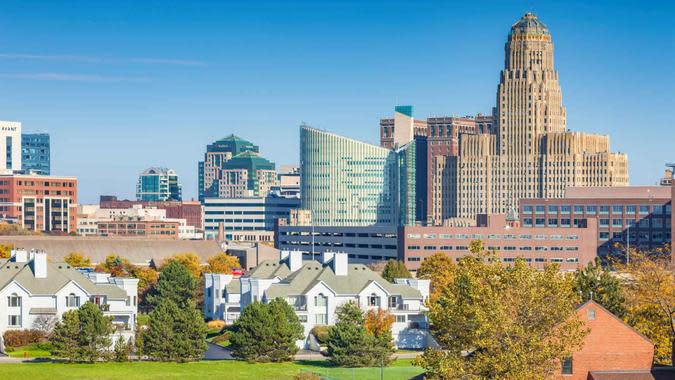
Buffalo, New York
Percentage of population aged 65 and over: 13.4%
Household average retirement income: $27,361
Livability index: 78
Average monthly expenditures cost: $2,025
Average rent cost: $1,312
Total cost of living monthly: $3,337
Total cost of living annually: $40,048
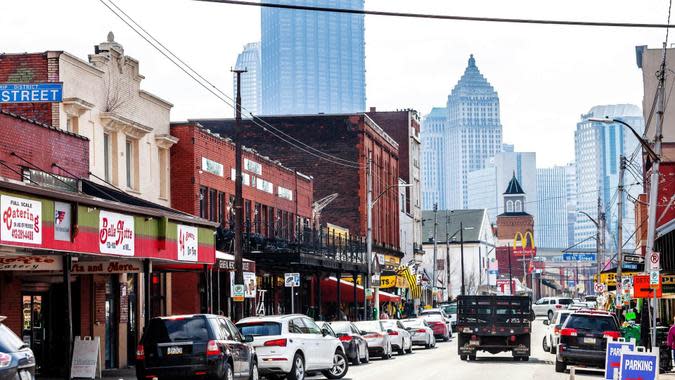
Pittsburgh
Percentage of population aged 65 and over: 15.1%
Household average retirement income: $28,958
Livability index: 82
Average monthly expenditures cost: $1,896
Average rent cost: $1,460
Total cost of living monthly: $3,356
Total cost of living annually: $40,269
Omaha, Nebraska
Percentage of population aged 65 and over: 13.8%
Household average retirement income: $28,718
Livability index: 82
Average monthly expenditures cost: $2,053
Average rent cost: $1,315
Total cost of living monthly: $3,368
Total cost of living annually: $40,413

Norfolk, Virginia
Percentage of population aged 65 and over: 12.3%
Household average retirement income: $28,618
Livability index: 81
Average monthly expenditures cost: $1,904
Average rent cost: $1,542
Total cost of living monthly: $3,446
Total cost of living annually: $41,353
Discover More: Retirement Spending: 9 Things Even Spendthrifts Don’t Waste Money On
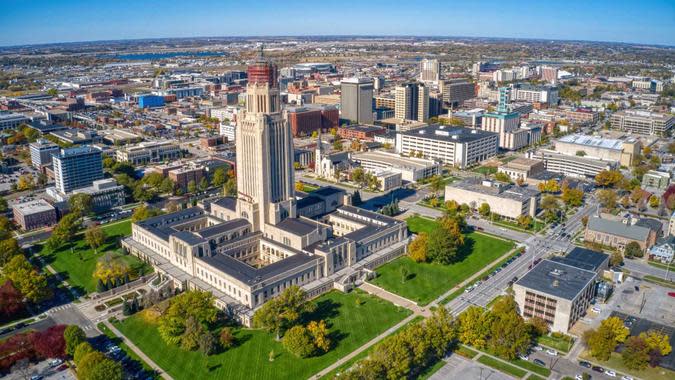
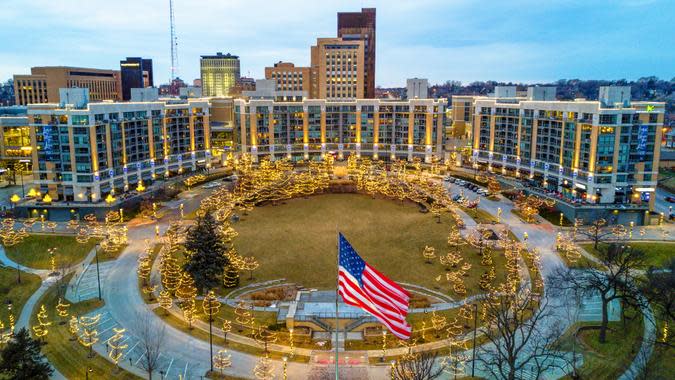
Lincoln, Nebraska
Percentage of population aged 65 and over: 14.0%
Household average retirement income: $33,200
Livability index: 83
Average monthly expenditures cost: $2,173
Average rent cost: $1,301
Total cost of living monthly: $3,474
Total cost of living annually: $41,687
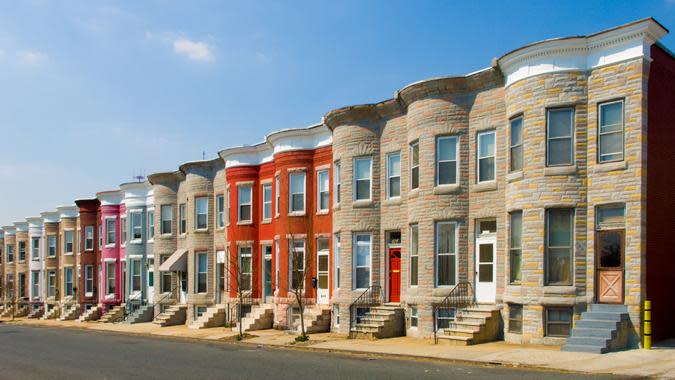
Baltimore
Percentage of population aged 65 and over: 14.8%
Household average retirement income: $29,136
Livability index: 77
Average monthly expenditures cost: $1,807
Average rent cost: $1,687
Total cost of living monthly: $3,493
Total cost of living annually: $41,921
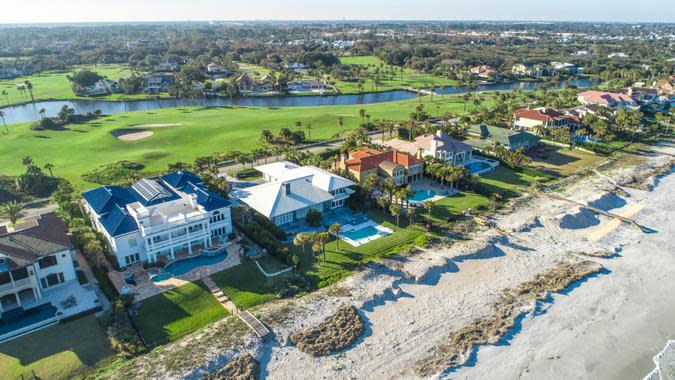
Jacksonville, Florida
Percentage of population aged 65 and over: 14.4%
Household average retirement income: $30,927
Livability index: 84
Average monthly expenditures cost: $1,876
Average rent cost: $1,627
Total cost of living monthly: $3,503
Total cost of living annually: $42,038

Arlington, Texas
Percentage of population aged 65 and over: 11.1%
Household average retirement income: $36,492
Livability index: 78
Average monthly expenditures cost: $1,883
Average rent cost: $1,621
Total cost of living monthly: $3,504
Total cost of living annually: $42,052
Try This: Tony Robbins: 5 Retirement Planning Tips He Swears By
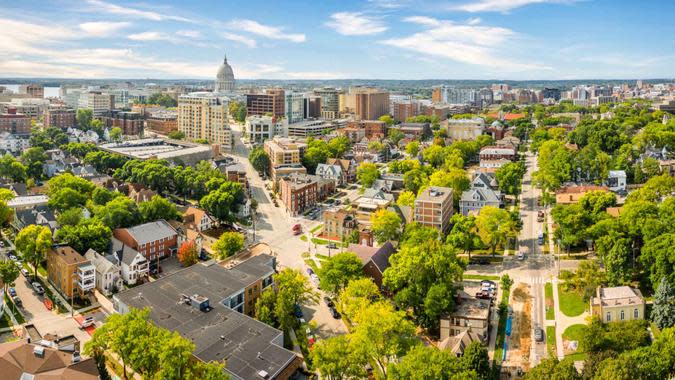
Madison, Wisconsin
Percentage of population aged 65 and over: 12.8%
Household average retirement income: $44,736
Livability index: 82
Average monthly expenditures cost: $1,967
Average rent cost: $1,548
Total cost of living monthly: $3,516
Total cost of living annually: $42,190

Mesa, Arizona
Percentage of population aged 65 and over:16.9%
Household average retirement income: $31,657
Livability index: 82
Average monthly expenditures cost: $1,833
Average rent cost: $1,689
Total cost of living monthly: $3,523
Total cost of living annually: $42,271

Minneapolis
Percentage of population aged 65 and over: 10.7%
Household average retirement income: $37,496
Livability index: 78
Average monthly expenditures cost: $1,895
Average rent cost: $1,628
Total cost of living monthly: $3,523
Total cost of living annually: $42,278
Irving, Texas
Percentage of population aged 65 and over: 8.3%
Household average retirement income: $30,168
Livability index: 78
Average monthly expenditures cost: $1,877
Average rent cost: $1,657
Total cost of living monthly: $3,534
Total cost of living annually: $42,408
Find Out: Why Florida’s Retirees Are Fleeing — And Where They’re Going Instead

Richmond, Virginia
Percentage of population aged 65 and over: 13.8%
Household average retirement income: $34,390
Livability index: 84
Average monthly expenditures cost: $1,984
Average rent cost: $1,553
Total cost of living monthly: $3,536
Total cost of living annually: $42,435

Raleigh, North Carolina
Percentage of population aged 65 and over: 11.4%
Household average retirement income: $36,179
Livability index: 84
Average monthly expenditures cost: $1,870
Average rent cost: $1,669
Total cost of living monthly: $3,539
Total cost of living annually: $42,463

Dallas
Percentage of population aged 65 and over: 11.0%
Household average retirement income: $36,043
Livability index: 81
Average monthly expenditures cost: $1,876
Average rent cost: $1,710
Total cost of living monthly: $3,586
Total cost of living annually: $43,028

Fort Worth, Texas
Percentage of population aged 65 and over: 10.1%
Household average retirement income: $34,435
Livability index: 80
Average monthly expenditures cost: $1,886
Average rent cost: $1,700
Total cost of living monthly: $3,586
Total cost of living annually: $43,028
Read Next: 10 Things Boomers Should Always Buy in Retirement

Glendale, Arizona
Percentage of population aged 65 and over: 12.8%
Household average retirement income: $29,223
Livability index: 78
Average monthly expenditures cost: $1,839
Average rent cost: $1,749
Total cost of living monthly: $3,588
Total cost of living annually: $43,059

Durham, North Carolina
Percentage of population aged 65 and over: 12.7%
Household average retirement income: $33,693
Livability index: 82
Average monthly expenditures cost: $1,879
Average rent cost: $1,713
Total cost of living monthly: $3,592
Total cost of living annually: $43,104

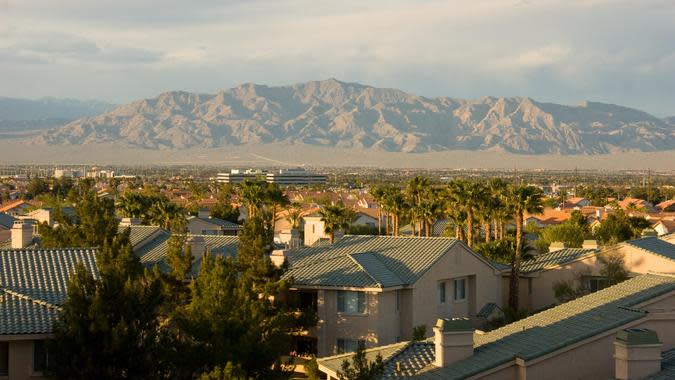
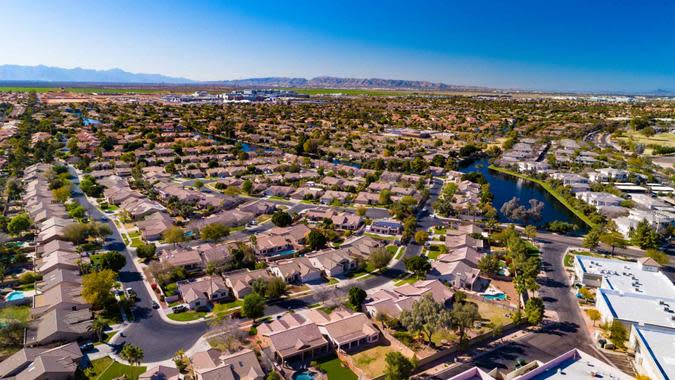
Las Vegas
Percentage of population aged 65 and over: 15.3%
Household average retirement income: $35,289
Livability index: 82
Average monthly expenditures cost: $1,881
Average rent cost: $1,732
Total cost of living monthly: $3,614
Total cost of living annually: $43,366

Charlotte, North Carolina
Percentage of population aged 65 and over: 10.7%
Household average retirement income: $33,845
Livability index: 80
Average monthly expenditures cost: $1,862
Average rent cost: $1,762
Total cost of living monthly: $3,624
Total cost of living annually: $43,492
Explore More: Retirement 2024: These Are the 10 Worst Places To Retire in North Carolina

Austin, Texas
Percentage of population aged 65 and over: 9.8%
Household average retirement income: $42,283
Livability index: 83
Average monthly expenditures cost: $1,898
Average rent cost: $1,730
Total cost of living monthly: $3,629
Total cost of living annually: $43,545
Plano, Texas
Percentage of population aged 65 and over: 13.7%
Household average retirement income: $38,150
Livability index: 83
Average monthly expenditures cost: $1,898
Average rent cost: $1,738
Total cost of living monthly: $3,636
Total cost of living annually: $43,638
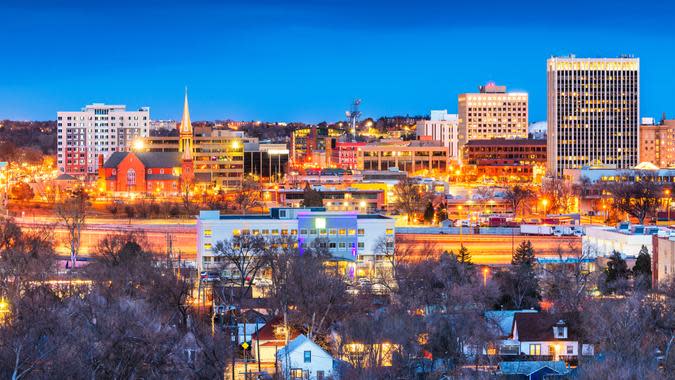
Colorado Springs, Colorado
Percentage of population aged 65 and over: 14.3%
Household average retirement income: $41,394
Livability index: 80
Average monthly expenditures cost: $1,855
Average rent cost: $1,809
Total cost of living monthly: $3,664
Total cost of living annually: $43,969

Portland, Oregon
Percentage of population aged 65 and over: 14.0%
Household average retirement income: $38,251
Livability index: 78
Average monthly expenditures cost: $1,926
Average rent cost: $1,746
Total cost of living monthly: $3,671
Total cost of living annually: $44,057
Learn More: I’m a Baby Boomer Who Had To Un-Retire: 3 Money Lessons I Wish I’d Known

Philadelphia
Percentage of population aged 65 and over:14.0%
Household average retirement income: $27,882
Livability index: 76
Average monthly expenditures cost: $1,952
Average rent cost: $1,726
Total cost of living monthly: $3,678
Total cost of living annually: $44,136

Reno, Nevada
Percentage of population aged 65 and over:15.8%
Household average retirement income: $40,641
Livability index: 80
Average monthly expenditures cost: $1,849
Average rent cost: $1,869
Total cost of living monthly: $3,718
Total cost of living annually: $44,621
North Las Vegas, Nevada
Percentage of population aged 65 and over: 11.5%
Household average retirement income: $33,425
Livability index: 76
Average monthly expenditures cost: $1,883
Average rent cost: $1,859
Total cost of living monthly: $3,743
Total cost of living annually: $44,911

Nashville, Tennessee
Percentage of population aged 65 and over: 12.6%
Household average retirement income: $28,655
Livability index: 78
Average monthly expenditures cost: $1,865
Average rent cost: $1,887
Total cost of living monthly: $3,753
Total cost of living annually: $45,032
Be Aware: Suze Orman: Why Even Big Retirement Savers Are at Risk
Chandler, Arizona
Percentage of population aged 65 and over: 12.5%
Household average retirement income: $33,372
Livability index: 77
Average monthly expenditures cost: $1,845
Average rent cost: $1,944
Total cost of living monthly: $3,790
Total cost of living annually: $45,476

Atlanta
Percentage of population aged 65 and over: 12.0%
Household average retirement income: $42,380
Livability index: 78
Average monthly expenditures cost: $1,884
Average rent cost: $1,939
Total cost of living monthly: $3,823
Total cost of living annually: $45,873

Anchorage, Alaska
Percentage of population aged 65 and over: 12.0%
Household average retirement income: $52,406
Livability index: 77
Average monthly expenditures cost: $2,303
Average rent cost: $1,552
Total cost of living monthly: $3,854
Total cost of living annually: $46,254

Orlando, Florida
Percentage of population aged 65 and over: 10.8%
Household average retirement income: $28,686
Livability index: 81
Average monthly expenditures cost: $1,924
Average rent cost: $1,974
Total cost of living monthly: $3,898
Total cost of living annually: $46,773
Check Out: 4 Things Boomers Should Never Sell in Retirement

Virginia Beach, Virginia
Percentage of population aged 65 and over:15.0%
Household average retirement income: $41,131
Livability index: 83
Average monthly expenditures cost: $2,050
Average rent cost: $1,874
Total cost of living monthly: $3,923
Total cost of living annually: $47,079
Aurora, Colorado
Percentage of population aged 65 and over: 11.9%
Household average retirement income: $34,682
Livability index: 76
Average monthly expenditures cost: $1,981
Average rent cost: $1,946
Total cost of living monthly: $3,927
Total cost of living annually: $47,129

Gilbert, Arizona
Percentage of population aged 65 and over: 10.2%
Household average retirement income: $34,627
Livability index: 89
Average monthly expenditures cost: $1,844
Average rent cost: $2,170
Total cost of living monthly: $4,015
Total cost of living annually: $48,179

Chicago
Percentage of population aged 65 and over: 13.3%
Household average retirement income: $38,501
Livability index: 78
Average monthly expenditures cost: $1,911
Average rent cost: $2,126
Total cost of living monthly: $4,037
Total cost of living annually: $48,446
For You: 7 Bills You Never Have To Pay When You Retire

Tampa, Florida
Percentage of population aged 65 and over: 13.0%
Household average retirement income: $35,075
Livability index: 80
Average monthly expenditures cost: $1,892
Average rent cost: $2,167
Total cost of living monthly: $4,059
Total cost of living annually: $48,707

Scottsdale, Arizona
Percentage of population aged 65 and over: 25.1%
Household average retirement income: $45,771
Livability index: 77
Average monthly expenditures cost: $1,868
Average rent cost: $2,195
Total cost of living monthly: $4,063
Total cost of living annually: $48,760

Sacramento, California
Percentage of population aged 65 and over: 13.8%
Household average retirement income: $46,344
Livability index: 76
Average monthly expenditures cost: $2,033
Average rent cost: $2,089
Total cost of living monthly: $4,122
Total cost of living annually: $49,464

Arlington, Virginia
Percentage of population aged 65 and over: 11.3%
Household average retirement income: $68,180
Livability index: 86
Average monthly expenditures cost: $2,153
Average rent cost: $2,502
Total cost of living monthly: $4,656
Total cost of living annually: $55,866
Discover More: Here’s How Much the Definition of Middle Class Has Changed in Every State

Chula Vista, California
Percentage of population aged 65 and over: 12.2%
Household average retirement income: $43,493
Livability index: 77
Average monthly expenditures cost: $2,088
Average rent cost: $2,933
Total cost of living monthly: $5,021
Total cost of living annually: $60,250
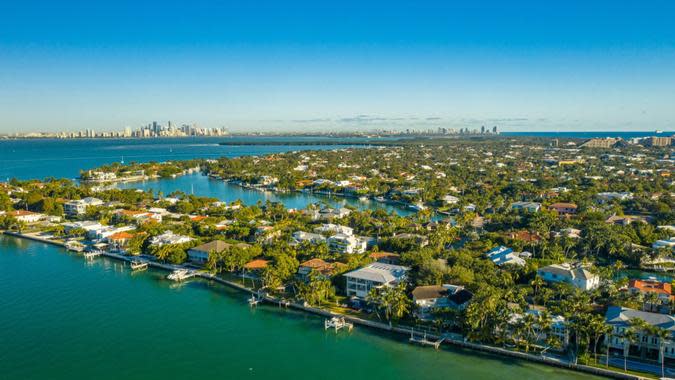
Miami
Percentage of population aged 65 and over: 16.3%
Household average retirement income: $53,788
Livability index: 81
Average monthly expenditures cost: $1,914
Average rent cost: $3,125
Total cost of living monthly: $5,039
Total cost of living annually: $60,469

Jersey City, New Jersey
Percentage of population aged 65 and over: 11.3%
Household average retirement income: $27,085
Livability index: 77
Average monthly expenditures cost: $2,012
Average rent cost: $3,042
Total cost of living monthly: $5,054
Total cost of living annually: $60,648

Fremont, California
Percentage of population aged 65 and over: 13.0%
Household average retirement income: $46,263
Livability index: 83
Average monthly expenditures cost: $2,148
Average rent cost: $3,007
Total cost of living monthly: $5,154
Total cost of living annually: $61,854
Read Next: ‘Rich Dad’ Robert Kiyosaki: Buy These 8 Assets To Get So Rich You Can Quit Your Job Forever
San Jose, California
Percentage of population aged 65 and over: 13.7%
Household average retirement income: $42,727
Livability index: 81
Average monthly expenditures cost: $2,272
Average rent cost: $3,142
Total cost of living monthly: $5,414
Total cost of living annually: $64,965
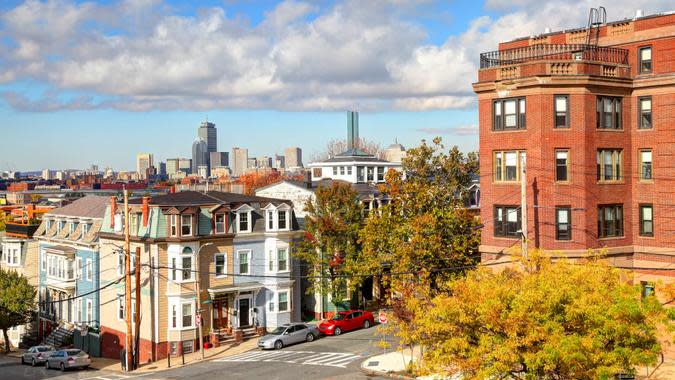
Boston
Percentage of population aged 65 and over: 12.3%
Household average retirement income: $41,437
Livability index: 77
Average monthly expenditures cost: $2,169
Average rent cost: $3,277
Total cost of living monthly: $5,447
Total cost of living annually: $65,360

New York
Percentage of population aged 65 and over: 15.5%
Household average retirement income: $34,875
Livability index: 76
Average monthly expenditures cost: $2,477
Average rent cost: $3,462
Total cost of living monthly: $5,939
Total cost of living annually: $71,268
Methodology: For this study, GOBankingRates analyzed major cities across the United States to find the cost of a comfortable retirement. First, GOBankingRates found the most populated 100 cities as sourced from the U.S. Census American Community Survey. For each city, a number of factors were found, including: total population, population aged 65 and over, total households, percent households with retirement income, and average household retirement income, all sourced from the U.S. Census American Community Survey; the cost of living indexes, as sourced from Sperlings BestPlaces; livability index, as sourced from AreaVibes; and the average rental cost, as sourced from the Zillow Observed Rental Index. The cost of living indexes were multiplied by the national average expenditure costs for retired residents, as sourced from the Bureau of Labor Statistics Consumer Expenditure Survey for retired residents, to find the average expenditure cost for each city. The average rental cost was added to the average expenditure cost to find the total cost of living for each city. The cities with a livability of 75 and below were removed for this study. The cities were sorted to show the highest to lowest total cost of living, representing the highest to lowest cost for a comfortable retirement. All data was collected on and is up to date as of May 16, 2024.
More From GOBankingRates
In Less Than a Decade, You Won't Be Able To Afford Homes in These 20 Arizona ZIP Codes
These 10 Used Cars Will Last Longer Than an Average New Vehicle
Trying to Build Your Savings? Make Sure Your Account Does These 6 Things
This article originally appeared on GOBankingRates.com: What a Comfortable Retirement Will Cost You in 61 of the Largest US Cities
