Bidenomics Report Card: Methodology
The Yahoo Finance Bidenomics Report Card measures the performance of the economy under President Joe Biden, compared with its performance under other presidents going back to Jimmy Carter in the 1970s. We first developed this methodology for the Trumponomics Report Card, which we unveiled in 2017 to assess the economy under President Donald Trump. The only difference is we are comparing Biden with seven prior presidents, including Trump, while we measured Trump against six prior presidents. Data limitations make it difficult to go back further than the 1970s.
We chose the following six economic indicators as proxies for the health of the overall economy:
Employment, which reflects job growth.
Manufacturing employment, which measures job growth in a key sector that recent presidents, including Biden and Trump, have promised to rebuild.
Average hourly earnings, adjusted for inflation, which reflects the extent to which American workers are getting ahead.
Exports, which measures the quantity of goods and services American producers sell outside the United States.
The S&P 500 index, which measures the performance of the stock market.
Real GDP per capita, which measures economic growth relative to the size of the U.S. population.
Moody’s Analytics is providing the data, organized in a way that allows apples-to-apples comparisons with prior presidents. We are comparing Biden's first term with the first terms of other presidents, since policy changes likely to affect the economy tend to occur in a new president’s first four years. So we are measuring the Biden economy against the economy under Donald Trump beginning in 2017, Barack Obama starting in 2009, George W. Bush starting in 2001, Bill Clinton starting in 1993, George H. W. Bush starting in 1989, Ronald Reagan starting in 1981 and Jimmy Carter starting in 1977.
All of this data is publicly available, published by the Bureau of Labor Statistics, the Census Bureau and the Bureau of Economic Analysis—all government agencies—along with Standard & Poor’s. Moody’s Analytics has crunched the data for Yahoo Finance, and applied its own methodology to the creation of indexes for four of the indicators.
For five of the six indicators—the two employment measures, earnings, exports and stocks—the data is published monthly, and we tally the data using February of each president’s first year as the starting point. For GDP, which is reported quarterly, we use the first quarter of each president’s first year as the starting point.
For the two employment measures, we use the cumulative sum of new jobs created since the starting point. For the other four indicators, Moody’s Analytics has created indexes, with the first month representing 100. Each president’s performance is then reported as the change from the starting point. This allows us to place the Biden economy on a spectrum bounded by the best and worst performing presidents for each indicator.
For five of the six indicators, there are 8 possible points on the spectrum, represented by the 8 dots you see on the report card: the Biden numbers, along with those for 7 prior presidents. For exports, the data only goes back to 1993, so there are only 5 dots on the spectrum: the numbers for Biden, Trump, Obama, George W. Bush and Clinton.
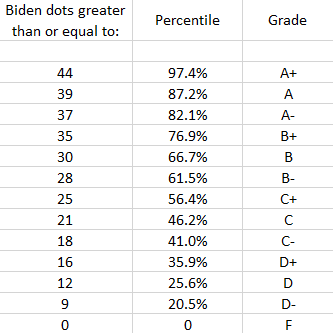
To convert the economic data to letter grades, we calculated the total number of Biden “dots” as a portion of the total possible number of dots. The highest possible total will be 8 dots in each of 5 categories, and 5 dots in the remaining category, exports: (5×8) + (1×5), or 45.
To determine Biden's grade, we divide the number of Biden dots by the total possible, coming up with a percentile between 0% and 100%. To convert percentiles into letter grades, we begin with the principle that the 50th percentile, relative to other presidents, represents a C grade. Then we spread the grades out evenly across the full range of possible outcomes. Here’s our complete grading range:
We believe this methodology is fair and transparent, yet we also realize it doesn’t account for every development that can affect the direction of the economy. The business cycle has natural swings, and it’s important to keep in mind the six recessions that occurred during the time we’re analyzing, which, according to the National Bureau of Economic Research, were:
January 1980 – July 1980
July 1981 – November 1982
July 1990 – March 1991
March 2001 – November 2001
December 2007 – June 2009
February 2020 - April 2020
Other factors affecting the economy include pandemics, wars and abrupt swings in the price of commodities such as oil, along with other unpredictable events. We welcome debate over our report card and invite our audience to leave comments in our Twitter or Facebook feeds.
Rick Newman is the author of four books, including "Rebounders: How Winners Pivot from Setback to Success.” Follow him on Twitter: @rickjnewman. You can also send confidential tips, and click here to get Rick’s stories by email.
