The Best (and Worst) US Cities for Work-Life Balance

Whether you work remote or in an office, all employees should be able to maintain a healthy work-life balance as they make money. Doing so is a win for your physical health, relationships and productivity, to name a few areas of impact. And while some employees may have expectations that moving to a new city, such as those on the coasts, can offer the ideal work-life balance, the reality is some of the best cities for work-life balance are found in flyover states.
Learn More: How Can You Withdraw Money From a Bank Account? 3 Ways To Know
Explore Next: 6 Unusual Ways To Make Extra Money (That Actually Work)
To find out which cities are the best and worst for work-life balance, GOBankingRates analyzed over 113 cities with 100,000 or more workers. Factors found in each city include the total population, total households, median household income, average travel time to work, average hours worked per week, labor force participation rate and unemployment rate. Each city’s overall average expenditure costs were calculated using the national average expenditure cost sourced from the Bureau of Labor Statistics Consumer Expenditure Survey. States like Minnesota and Nebraska had several cities mentioned among the best for work-life balance. Three California cities, on the other hand, ranked among the 10 worst.
Read on to discover the 10 best, and 10 worst, cities for work-life balance.

10 Best Cities for Work-Life Balance
Featuring cities in states like Utah, Michigan and Minnesota, these places offer their residents the type of work-life balance that helps keep professional and personal lives on track.
Try This: Check Your $2 Bills — They Could Be Worth a Ton
Read More: I’m a Bank Teller: 3 Times You Should Never Ask For $100 Bills at the Bank

10. Minneapolis, Minnesota
Total workers: 239,114
Total households: 185,674
Total population: 353,178
Average travel time to work (minutes): 22.9
Average hours worked per week: 37.5
Labor force participation rate (percentage): 73.5
Unemployment rate (percentage): 5.8
Livability index: 78.0
Cost of living index: 107.2
Median household income: $76,332
Average monthly cost of expenditures: $2,156.52
That’s Interesting: 7 Things To Know If You Withdraw More Than $10,000 From Your Checking Account

9. Omaha, Nebraska
Total workers: 251,518
Total households: 197,842
Total population: 381,682
Average travel time to work (minutes): 19.3
Average hours worked per week: 38.7
Labor force participation rate (percentage): 69.9
Unemployment rate (percentage): 4.2
Livability index: 82.0
Cost of living index: 90.8
Median household income: $70,202
Average monthly cost of expenditures: $2,233.01

8. St. Paul, Minnesota
Total workers: 158,824
Total households: 121,212
Total population: 242,714
Average travel time to work (minutes): 23.1
Average hours worked per week: 37.2
Labor force participation rate (percentage): 70.3
Unemployment rate (percentage): 5.0
Livability index: 80.0
Cost of living index: 102.3
Median household income: $69,919
Average monthly cost of expenditures: $1,971.49
Check Out: Warren Buffett’s Parenting Rule: The Key to Raising Money-Savvy Kids

7. Lexington, Kentucky
Total workers: 165,422
Total households: 136,104
Total population: 262,506
Average travel time to work (minutes): 20.8
Average hours worked per week: 37.9
Labor force participation rate (percentage): 67.9
Unemployment rate (percentage): 5.0
Livability index: 86.0
Cost of living index: 90.8
Median household income: $66,087
Average monthly cost of expenditures: $1,901.74
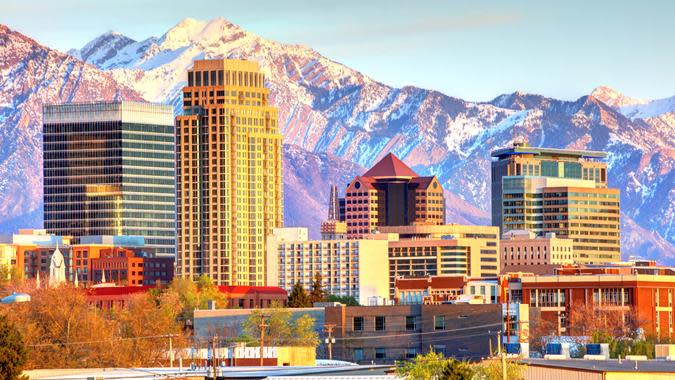
6. Salt Lake City, Utah
Total workers: 116,396
Total households: 85,435
Total population: 168,935
Average travel time to work (minutes): 19.7
Average hours worked per week: 37.9
Labor force participation rate (percentage): 73.0
Unemployment rate (percentage): 3.6
Livability index: 75.0
Cost of living index: 121.3
Median household income: $72,357
Average monthly cost of expenditures: $2,044.71
Trending Now: Suze Orman: 3 Ways To Prepare for the Upcoming Financial Pandemic

5. Grand Rapids, Michigan
Total workers: 101,943
Total households: 79,009
Total population: 160,066
Average travel time to work (minutes): 19.2
Average hours worked per week: 37.5
Labor force participation rate (percentage): 68.7
Unemployment rate (percentage): 5.6
Livability index: 83.0
Cost of living index: 94.5
Median household income: $61,634
Average monthly cost of expenditures: $1,890.01

4. Sioux Falls, South Dakota
Total workers: 107,288
Total households: 79,753
Total population: 150,648
Average travel time to work (minutes): 16.8
Average hours worked per week: 39.4
Labor force participation rate (percentage): 74.2
Unemployment rate (percentage): 2.3
Livability index: 84.0
Cost of living index: 90.7
Median household income: $71,785
Average monthly cost of expenditures: $1,961.84
See More: 8 Rare Coins Worth Millions That Are Highly Coveted by Coin Collectors
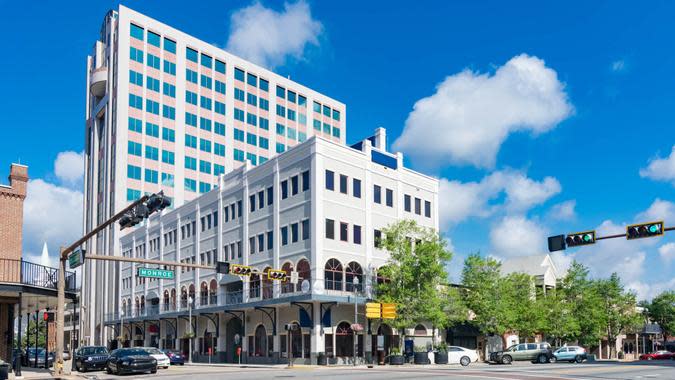
3. Tallahassee, Florida
Total workers: 101,139
Total households: 81,846
Total population: 168,620
Average travel time to work (minutes): 18.6
Average hours worked per week: 35.5
Labor force participation rate (percentage): 65.9
Unemployment rate (percentage): 6.5
Livability index: 82.0
Cost of living index: 91.2
Median household income: $52,899
Average monthly cost of expenditures: $2,064.56
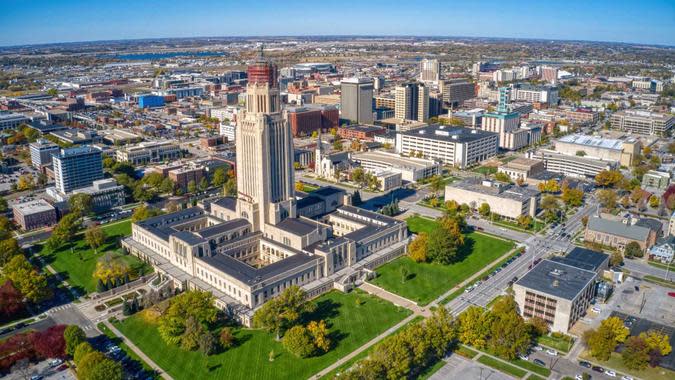
2. Lincoln, Nebraska
Total workers: 157,701
Total households: 118,332
Total population: 233,798
Average travel time to work (minutes): 18.6
Average hours worked per week: 37.2
Labor force participation rate (percentage): 70.9
Unemployment rate (percentage): 3.3
Livability index: 83.0
Cost of living index: 92.6
Median household income: $67,846
Average monthly cost of expenditures: $2,330.49
Discover Next: 10 of the Most Valuable Pennies
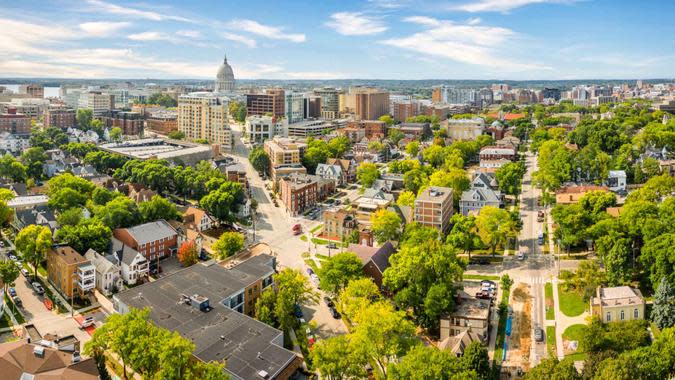
1. Madison, Wisconsin
Total workers: 154,669
Total households: 120,509
Total population: 229,019
Average travel time to work (minutes): 19.5
Average hours worked per week: 36.5
Labor force participation rate (percentage): 70.4
Unemployment rate (percentage): 2.6
Livability index: 81.0
Cost of living index: 103.4
Median household income: $74,895
Average monthly cost of expenditures: $2,183.35
10 Worst Cities for Work-Life Balance
Whether you find yourself dealing with lengthy commutes or struggling with considerable cost of living expenses, here are some of the worst places for maintaining work-life balance.
Learn More: Warren Buffett: 6 Best Pieces of Money Advice for the Middle Class

10. Santa Clarita, California
Total workers: 108,304
Total households: 73,362
Total population: 174,913
Average travel time to work (minutes): 35.2
Average hours worked per week: 38.6
Labor force participation rate (percentage): 67.3
Unemployment rate (percentage): 5.5
Livability index: 71
Cost of living index: 161.7
Median household income: $116,186
Average monthly cost of expenditures: $2,166.96

9. Philadelphia, Pennsylvania
Total workers: 717,569
Total households: 659,129
Total population: 1,284,522
Average travel time to work (minutes): 32.8
Average hours worked per week: 38.3
Labor force participation rate (percentage): 62.8
Unemployment rate (percentage): 8.6
Livability index: 77
Cost of living index: 104.3
Median household income: $57,537
Average monthly cost of expenditures: $2,115.39
Be Aware: 9 Bills Frugal People Don’t Pay
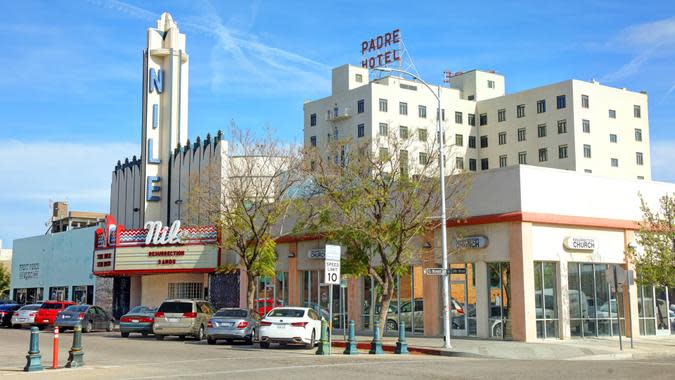
8. Bakersfield, California
Total workers: 169,417
Total households: 124,744
Total population: 296,960
Average travel time to work (minutes): 23.6
Average hours worked per week: 38.6
Labor force participation rate (percentage): 63.1
Unemployment rate (percentage): 7.1
Livability index: 58
Cost of living index: 99.8
Median household income: $73,827
Average monthly cost of expenditures: $2,068.80

7. Washington, D.C.
Total workers: 366,965
Total households: 315,785
Total population: 556,781
Average travel time to work (minutes): 30.5
Average hours worked per week: 40.4
Labor force participation rate (percentage): 72.0
Unemployment rate (percentage): 7.1
Livability index: 73
Cost of living index: 151.9
Median household income: $101,722
Average monthly cost of expenditures: $2,556.71
Discover More: 30 Best Games That Pay Real Money in 2024

6. Chicago, Illinois
Total workers: 1,352,496
Total households: 1,129,908
Total population: 2,237,215
Average travel time to work (minutes): 34.1
Average hours worked per week: 39.0
Labor force participation rate (percentage): 67.3
Unemployment rate (percentage): 8.2
Livability index: 76
Cost of living index: 105.7
Median household income: $71,673
Average monthly cost of expenditures: $2,141.75

5. Jersey City, New Jersey
Total workers: 151,313
Total households: 119,278
Total population: 234,410
Average travel time to work (minutes): 37.0
Average hours worked per week: 39.6
Labor force participation rate (percentage): 69.8
Unemployment rate (percentage): 5.8
Livability index: 77
Cost of living index: 139.5
Median household income: $91,151
Average monthly cost of expenditures: $2,194.09
Read Next: This Amazon Side Hustle Made $140K per Month in Passive Income

4. Newark, New Jersey
Total workers: 128,392
Total households: 112,635
Total population: 241,044
Average travel time to work (minutes): 33.0
Average hours worked per week: 36.9
Labor force participation rate (percentage): 62.2
Unemployment rate (percentage): 10.7
Livability index: 67
Cost of living index: 135.0
Median household income: $46,460
Average monthly cost of expenditures: $2,158.86

3. Detroit, Michigan
Total workers: 224,797
Total households: 249,518
Total population: 496,762
Average travel time to work (minutes): 25.7
Average hours worked per week: 37.6
Labor force participation rate (percentage): 54.8
Unemployment rate (percentage): 14.7
Livability index: 73
Cost of living index: 91.8
Median household income: $37,761
Average monthly cost of expenditures: $1,899.60
Try This: How To Earn $4,000 a Month in Passive Income

2. New York, New York
Total workers: 3,991,760
Total households: 3,282,804
Total population: 7,037,637
Average travel time to work (minutes): 41.1
Average hours worked per week: 38.4
Labor force participation rate (percentage): 63.2
Unemployment rate (percentage): 7.6
Livability index: 76
Cost of living index: 172.5
Median household income: $76,607
Average monthly cost of expenditures: $2,682.19

1. Stockton, California
Total workers: 129,635
Total households: 96,975
Total population: 242,799
Average travel time to work (minutes): 32.8
Average hours worked per week: 38.1
Labor force participation rate (percentage): 60.3
Unemployment rate (percentage): 7.7
Livability index: 61
Cost of living index: 124.7
Median household income: $71,612
Average monthly cost of expenditures: $2,148.51
Heather Taylor contributed to the reporting for this piece.
Methodology: For this study, GOBankingRates analyzed over 113 cities with 100,000 or more workers aged 16 and over as sourced from the US Census American Community Survey. For each city a number of factors were found including total population, total households, median household income, average travel time to work, average hours worked per week, labor force participation rate, and unemployment rate all sourced from the US Census American Community Survey. The cost-of-living index was sourced from Sperling’s BestPlaces and using the national average expenditure cost as sourced from the Bureau of Labor Statistics Consumer Expenditure Survey for all residents, the overall average expenditure costs can be calculated for each city. The livability index was also sourced as supplemental information as sourced from AreaVibes. The average travel time to work was scored and weighted at 1.50, the average hours worked per week was scored and weighted at 1.50, the labor force participation rate was scored and weighted at 1.00, the unemployment rate was scored and weighted at 1.00, and the livability index was scored and weighted at 1.00. All the scores were summed and sorted to find the best cities for work-life balance. All data was collected on and is up to date as of April 11th, 2024.
More From GOBankingRates
This article originally appeared on GOBankingRates.com: The Best (and Worst) US Cities for Work-Life Balance
