Beaufort County school report cards from state are out. How did your school fare?
Unlike students, Beaufort County schools don’t have to wait for a manila envelope at the end of the semester to see their report card.
The district is on par with the state, according to the South Carolina school report cards released Wednesday. The report cards classify each school based on how well they meet “the criteria to ensure all students meet the Profile of the South Carolina Graduate.” Report cards were last released in 2019 and reflect the 2021-2022 school year.
The ratings are:
Excellent – School performance substantially exceeds the criteria
Good - School performance exceeds the criteria
Average - School performance meets the criteria
Below Average - School performance is in jeopardy of not meeting the criteria
Unsatisfactory – School performance fails to meet the criteria
The ratings are based on school test scores, student progress and, for high schools, graduation rate.
A total of 79% of Beaufort County district schools are average, good or excellent, and 21% are below average or unsatisfactory. This is the same distribution as schools across the state.
“While the majority of the report card data is positive, the reality is that the state and Beaufort County are in a multi-year period of academic recovery,” Beaufort County Director of Accountability Daniel Fallon said at a school board meeting Oct. 18.
High Schools
100% of district high schools rated average, good or excellent:
Excellent
Bluffton High School
Good:
Hilton Head Island High School
May River High School
Average:
Battery Creek High School
Beaufort High School
Whale Branch Early College High School
Below Average:
None
Unsatisfactory:
None
Middle Schools
78% of district middle schools rated average, good or excellent:
Excellent:
H.E. McCracken Middle School
River Ridge Academy
Good:
Bluffton Middle School
Riverview Charter School
Average
Hilton Head Island Middle School
Robert Smalls International Academy
Whale Branch Middle School
Below Average:
Beaufort Middle School
Lady’s Island Middle School
Unsatisfactory:
None
Elementary Schools
74% of Elementary Schools rated average, good or excellent:
Excellent:
Beaufort Elementary School
Coosa Elementary School
Okatie Elementary
Red Cedar Elementary School
Good:
Bluffton Elementary
Michael C. Riley Elementary And Early Childhood Center
Port Royal Elementary School
Pritchardville Elementary School
River Ridge Academy
Average:
Broad River Elementary School
Hilton Head Island Elementary School
Lady’s Island Elementary School
Mossy Oaks Elementary
Riverview Charter School
Below Average:
Hilton Head Island Elementary School For The Creative Arts
Joseph Shanklin Elementary School
St. Helena Elementary
Unsatisfactory:
Robert Smalls International Academy
Whale Branch Elementary School
How are rankings determined?
Each school received a rating out of 100 points with various indicators weighting differently on a school’s score.
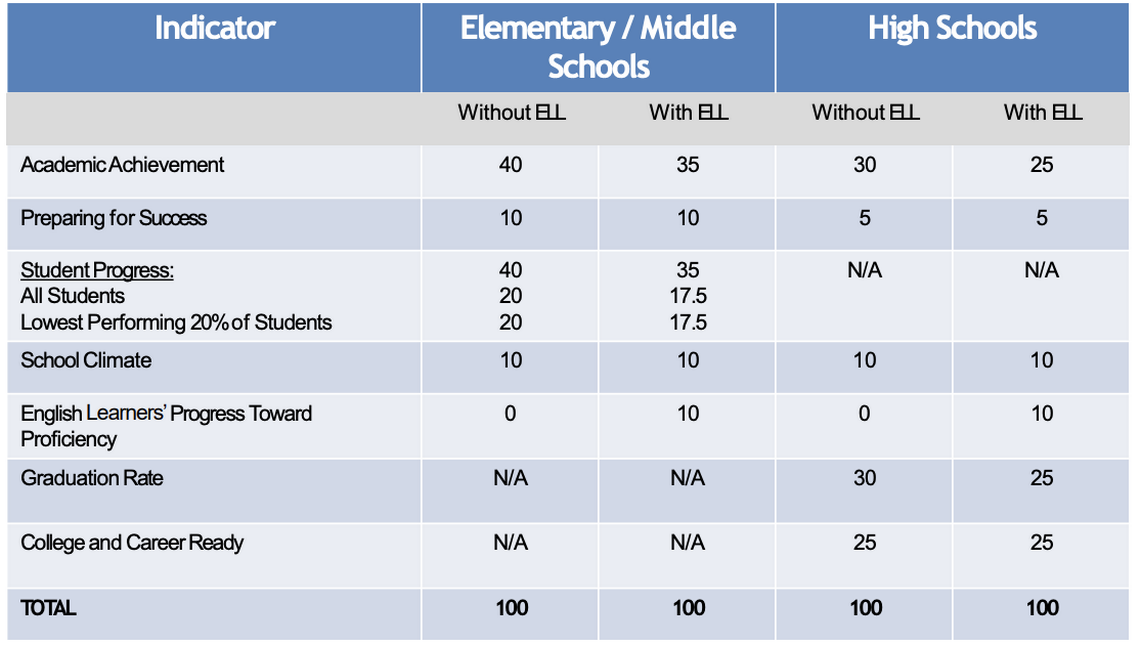
The indicators are:
▪ Academic Achievement
Academic achievement is based on S.C. Ready assessment results in grades three through eight, South Carolina Alternative assessments for students with significant cognitive disabilities, and end-of-course assessments in Algebra 1 and English 2 for high school students.
For S.C. Ready assessments, 48.7% of Beaufort students met or exceeded grade level expectations for reading and writing, and 41.6% met or exceeded grade level expectations for math. These are within 5 percentage points of state percentages: 46.6% and 38.9%, respectively.
For English 1, 60.2% of students met or exceeded grade level expectations. For Algebra 1, 53.5% of students met or exceeded these expectations. The district scored similarly to the state’s 57.9% on English 1, and scored almost 10 percentage points higher than the state’s 44.2% on Algebra 1.
▪ Preparing for Success
This metric is based on SCPASS science and end-of-course Biology and U.S. History and the Constitution results.
For SCPASS science, 49.6% of district students and 46% of state students met expectations.
For end-of-course assessment results in biology, 49.2% of district students and 46.9% of state students scored a C or higher.
For end-of-course assessment results in U.S. history and the Constitution, 39.5% of district students and 37.8% of state students scored a C or higher.
▪ Student Progress
The district earned 48.2% of potential progress points, compared to the state’s 51.1%.
The progress of all district students, and the lowest performing 20% of students, was compared statewide to students who initially scored at the same level.
100% of progress points would mean that students made the same progress as expected.
“In other words, the expectation of progress is based upon how the individual students within the group performed, on average, compared to other students just like them across the state,” according to the report card description.
▪ School Climate
For the first time, school climate was a factor in the report cards. The district scored a 6.11 out of 10.
Despite multiple gun-related incidents last year, teachers had a 7.65 out of 10 rating of perception of school safety. Students surveyed lower at 5.62 out of 10. This compares to the state’s 8.03 and 5.1, respectively.
“Culture and climate is an important component in overall productivity in buildings,” Superintendent Frank Rodriguez said.
The district surveyed teachers, parents and students to gauge school climate. Surveys included overall perceptions of school climate, instructional focus, working conditions, safety, social-physical environment. Almost 92% of district teachers and students were surveyed. The report card didn’t provide parents participation percentages, but 829 were surveyed.
▪ English Learners’ Progress Toward Proficiency
This measures what percentage of students who meet their “progress toward proficiency target.” The goal for all district schools is that English learners will “become proficient in English within at least five years of their initial enrollment in public schools.”
55% of district students met their target compared to 54% of state students.
▪ Graduation Rate
86.2% of students in the class of 2022 completed high school “on time,” compared to 83.8% of state students.
“The graduation rate in the report card is measured by the percentage of students who complete high school ‘on time’ and earn a diploma in four years,” according to a district press release.
▪ College and Career Readiness
In Beaufort County, 74.5% of district students are career ready, 34% are college ready and 32.4% are both. 76% are either career ready or college ready, according to the report cards.
These percentages are based off of career readiness assessments, placement exams, the SAT and the ACT.
“Nationwide, 59% of students who took AP exams scored a 3 or better. The Beaufort County School District outperformed the nation at 69%,” according to a district press release. “BCSD expanded the number of students taking the SAT in 2022 and remains above national and state averages. The district’s ACT scores remain steady, also outperforming both the state and nation.”
(A previous version of this story categorized Bluffton High School as “Average,” but it is rated “Excellent.”)
