Brutal chart shows how Chris Christie has probably missed his moment to be president

New Jersey Gov. Chris Christie (R) is set to enter a crowded race for president on Tuesday, and he'll join the field as a clear underdog.
That's a surprising position for Christie to find himself in. Many Republican donors urged him to run against President Barack Obama in 2012. His popularity soared in the aftermath of Hurricane Sandy. And he cruised to a blowout re-election as governor in 2013.

(Photo credit: AP/Jim Cole)
But over the past year and a half, different elements have pummeled his image in and out of his home state. There's the Bridgegate scandal, to which he was never directly linked but which clearly damaged his reputation as an executive. Then there's the economic story under his governorship: He has endured nine credit downgrades under his watch and has had continual problems with his state's budget.
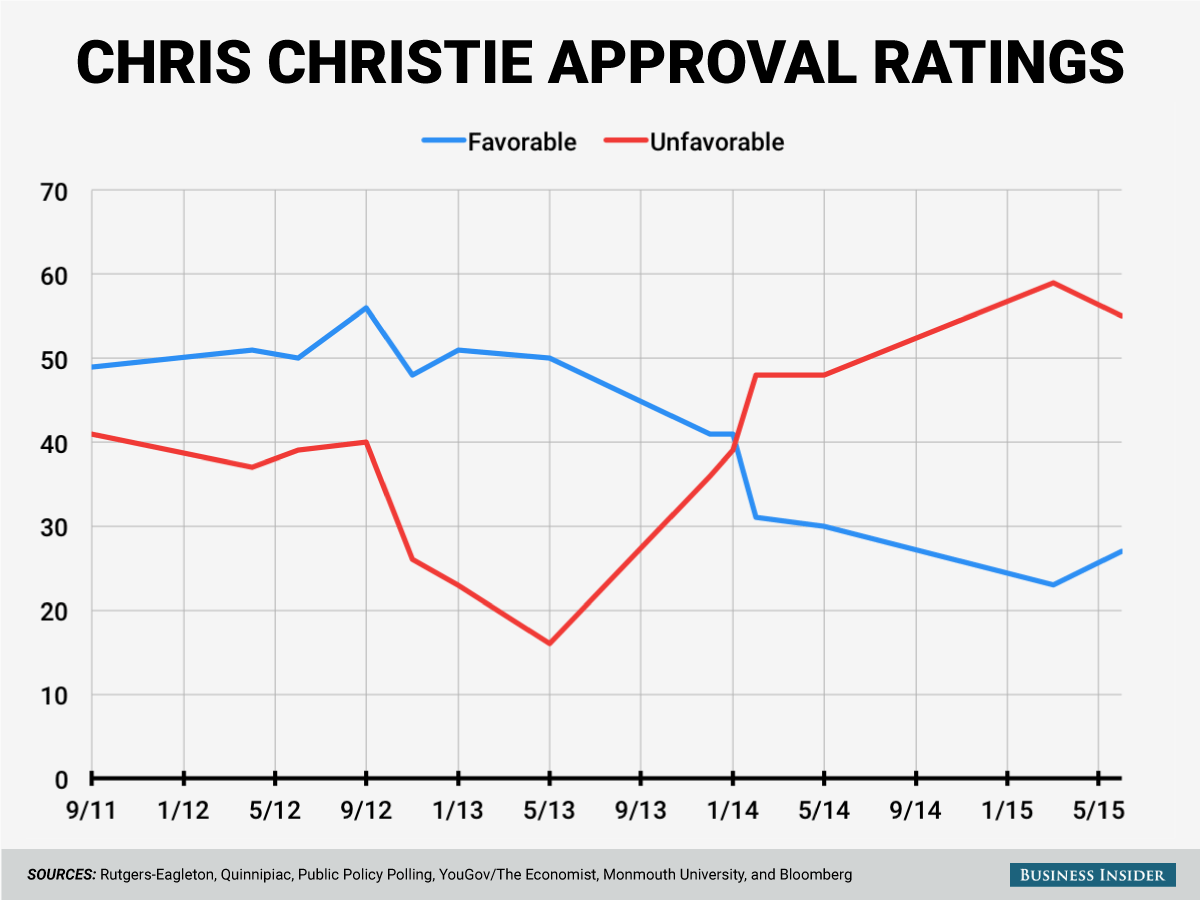
The chart below shows the change in Christie's fortunes, illustrating how the percentages of Americans who hold favorable and unfavorable views of the New Jersey governor have shifted over time. Christie's net favorability peaked in January 2013, when 51% of Americans had a favorable opinion, and just 23% had an unfavorable opinion.
Those numbers have flipped upside-down, with polling this month showing 27% favorable and 55% unfavorable:
NOW WATCH: This is the hardest part about being President Obama's personal chef
See Also:
Chris Christie is going to sell himself as the straight-talking presidential candidate
Activist takes down Confederate flag outside South Carolina state capitol
SEE ALSO: Only one group of Americans has become less accepting of homosexuality in the past 2 years
