America’s Middle Class Is Shrinking the Most in These 50 Cities

The middle class is often synonymous with having enough money to take care of all your basic expenses without struggling too much, but not having so much that you’re wealthy either.
Many people aspire to be middle class, particularly on the upper end of the range that is generally defined as making between $50,000 and $150,000.
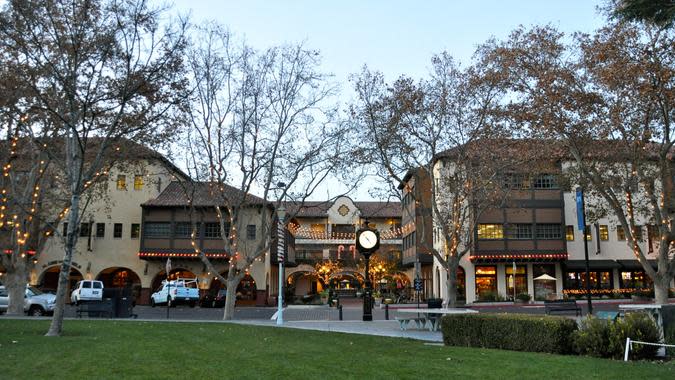
Discover Next: 7 Things the Middle Class Won’t Be Able To Afford in the Next 5 Years
Read More: 7 Unusual Ways To Make Extra Money (That Actually Work)
Yet, for a variety of reasons, including wage stagnation, steep inflation and more, the middle class is actually starting to shrink in many American cities, making it tougher to stay in this seemingly comfortable class bracket.
To get a better sense of just how much the middle class is shrinking, and where, GOBankingRates looked at all U.S. cities with 40,000 or more households, as sourced from the 2022 American Community Survey, in order to find the 50 cities where the middle class has shrunk the most. GOBankingRates then found which percent of each city’s households falls into that middle class range of earning between $50,000 and $150,000.
The cities were ranked on a five-year change in percentage of middle-class households from 2017 to 2022.
Read on to find out which 50 cities had the greatest decrease. Also see signs you might not be middle class anymore.
50. Corona, California
2022 total households: 46,524
2017 % of middle class households: 50.4
2022 % of middle class households: 47.5
5-year change: -5.75%
Find Out: How Much Household Income Will Be Considered Upper Middle Class in 5 Years?
Explore More: 7 Ways the Upper Middle Class Can Become Rich in 2024
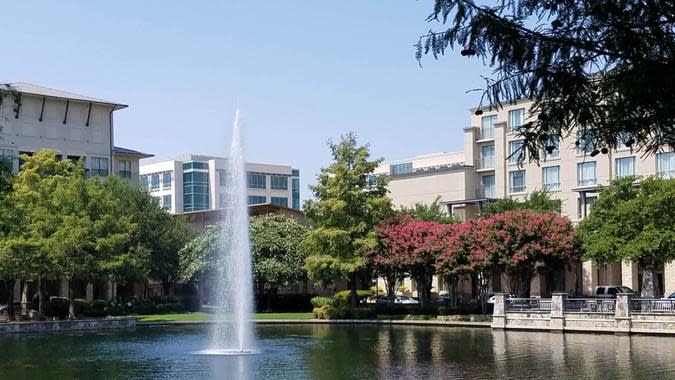
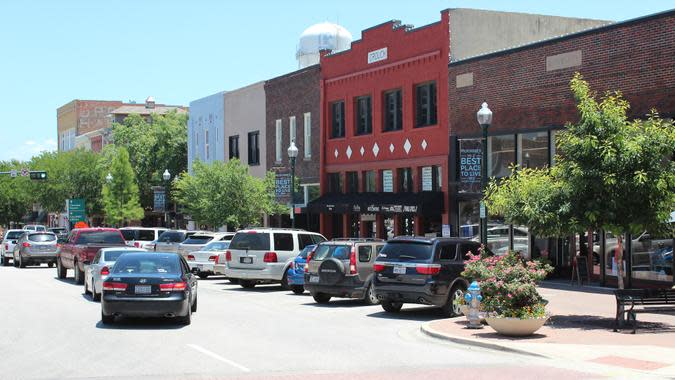
49. Plano, Texas
2022 total households: 107,448
2017 % of middle class households: 50.0
2022 % of middle class households: 47.1
5-year change: -5.80%
Learn More: How Far a $100,000 Salary Goes in America’s 50 Largest Cities

48. Chesapeake, Virginia
2022 total households: 91,368
2017 % of middle class households: 53.4
2022 % of middle class households: 50.2
5-year change: -5.99%
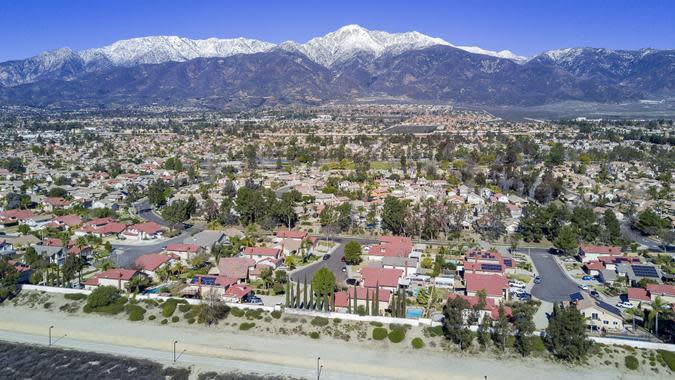
47. Rancho Cucamonga, California
2022 total households: 57,553
2017 % of middle class households: 52.5
2022 % of middle class households: 49.3
5-year change: -6.10%
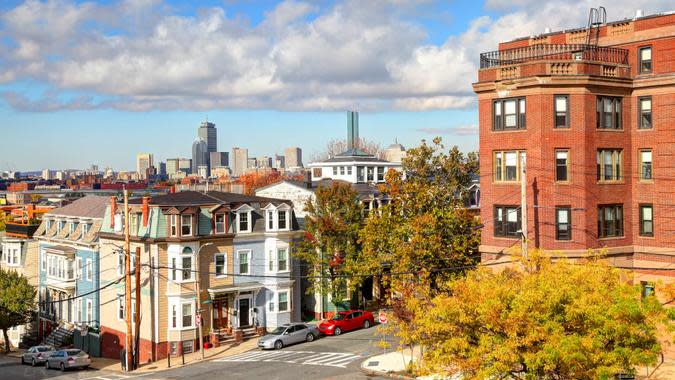
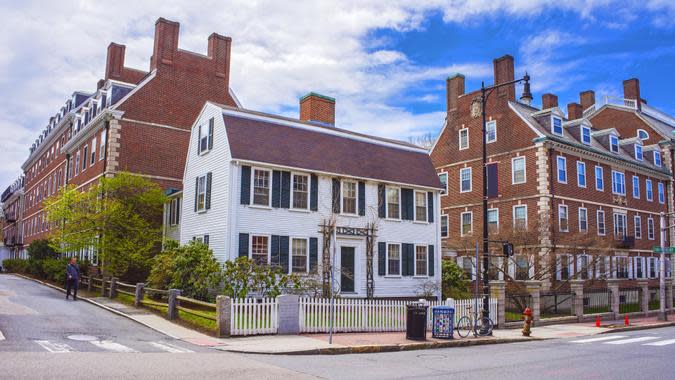
46. Boston
2022 total households: 276,053
2017 % of middle class households: 39.3
2022 % of middle class households: 36.9
5-year change: -6.11%
45. Torrance, California
2022 total households: 55,719
2017 % of middle class households: 47.0
2022 % of middle class households: 44.1
5-year change: -6.17%
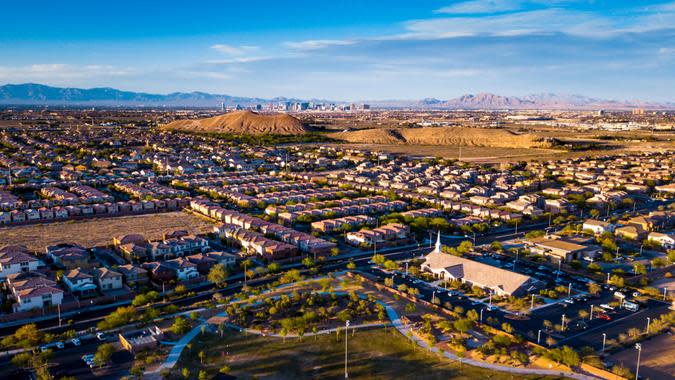
44. Enterprise, Nevada
2022 total households: 79,015
2017 % of middle class households: 57.0
2022 % of middle class households: 53.4
5-year change: -6.32%
Check Out: What Income Level Is Considered Middle Class in Your State?

43. Oakland, California
2022 total households: 170,282
2017 % of middle class households: 41.0
2022 % of middle class households: 38.4
5-year change: -6.34%
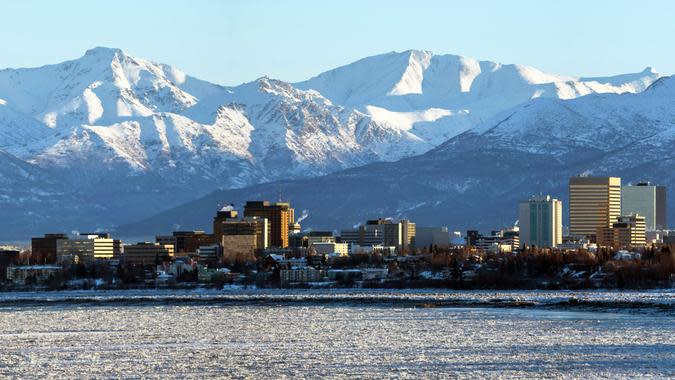
42. Anchorage, Alaska
2022 total households: 107,134
2017 % of middle class households: 52.9
2022 % of middle class households: 49.3
5-year change: -6.81%
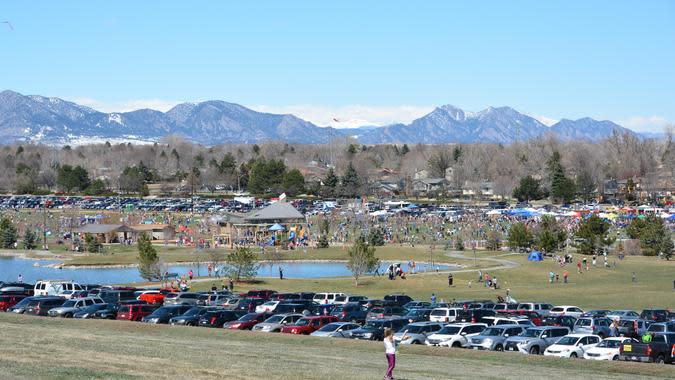
41. Arvada, Colorado
2022 total households: 50,211
2017 % of middle class households: 53.2
2022 % of middle class households: 49.5
5-year change: -6.95%
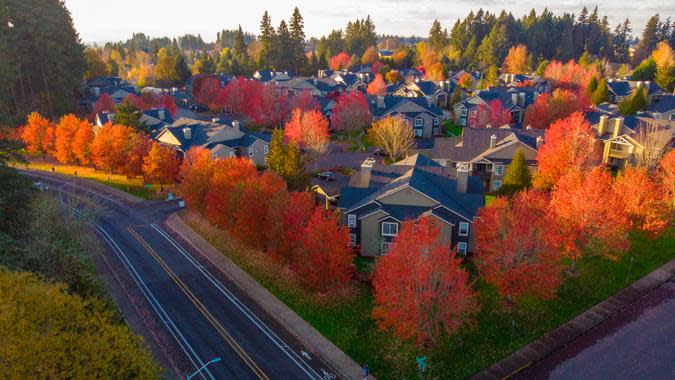
40. Hillsboro, Oregon
2022 total households: 40,633
2017 % of middle class households: 56.2
2022 % of middle class households: 52.2
5-year change: -7.12%
39. Fullerton, California
2022 total households: 47,014
2017 % of middle class households: 47.6
2022 % of middle class households: 44.1
5-year change: -7.35%
Trending Now: Warren Buffett’s 6 Best Pieces of Money Advice for the Middle Class
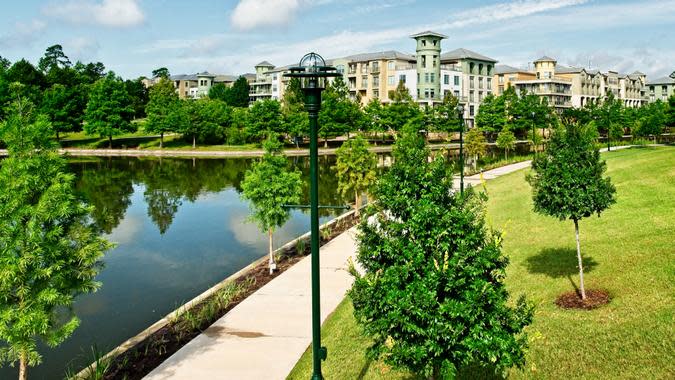
38. The Woodlands, Texas
2022 total households: 43,164
2017 % of middle class households: 37.7
2022 % of middle class households: 34.9
5-year change: -7.43%
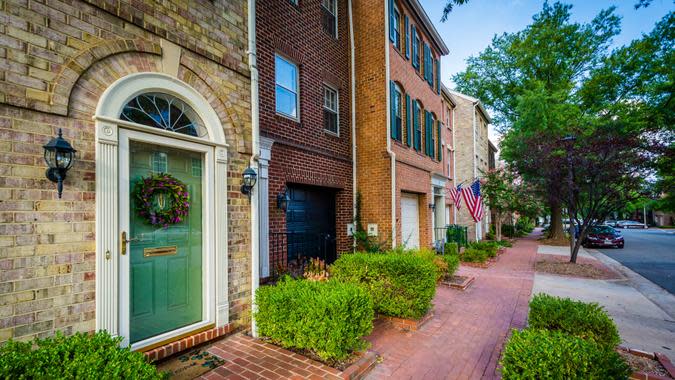
37. Alexandria, Virginia
2022 total households: 74,818
2017 % of middle class households: 48.5
2022 % of middle class households: 44.8
5-year change: -7.63%
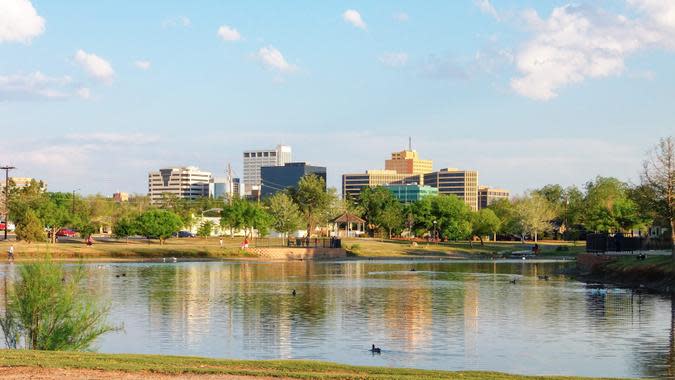
36. Midland, Texas
2022 total households: 51,460
2017 % of middle class households: 48.3
2022 % of middle class households: 44.6
5-year change: -7.66%

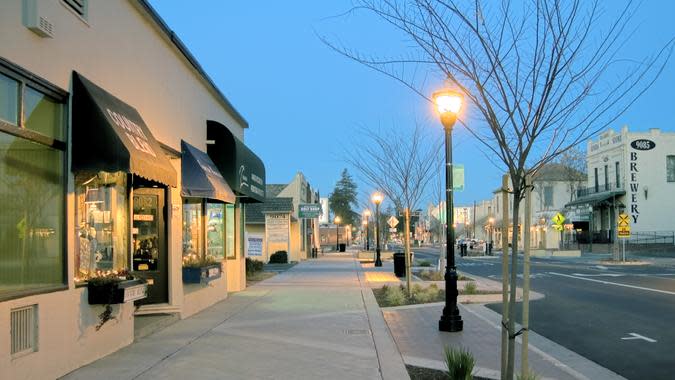
35. Ventura, California
2022 total households: 41,954
2017 % of middle class households: 51.4
2022 % of middle class households: 47.4
5-year change: -7.78%
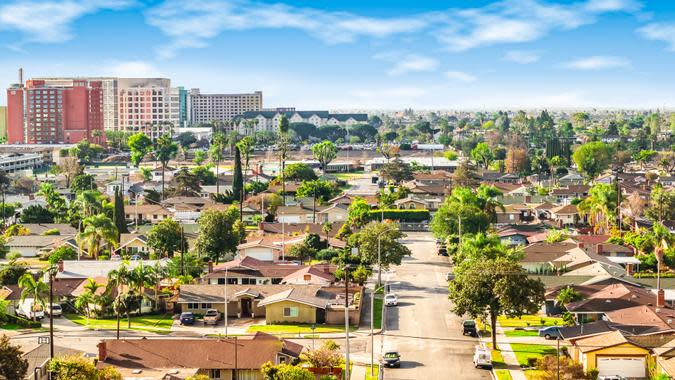
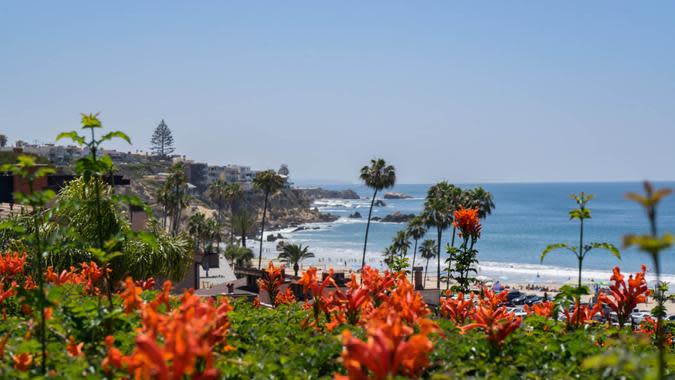
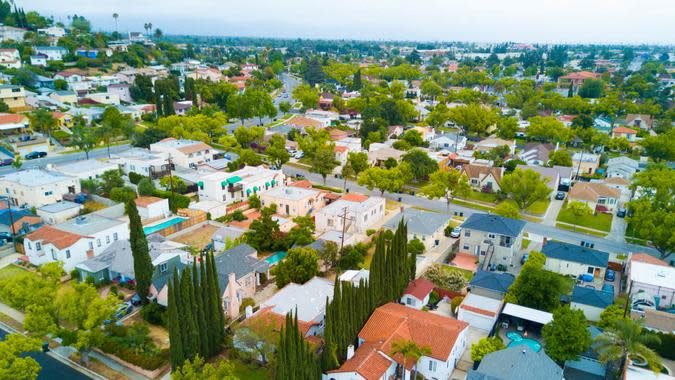
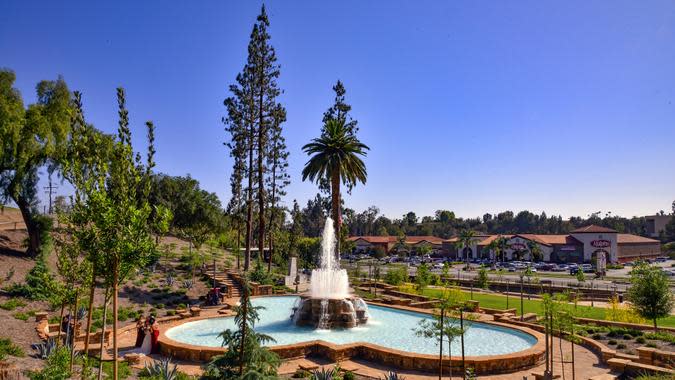
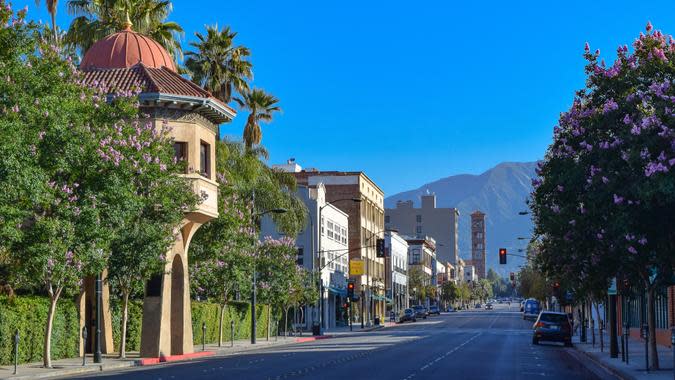
34. Orange, California
2022 total households: 44,336
2017 % of middle class households: 49.8
2022 % of middle class households: 45.6
5-year change: -8.43%
Pictured: Anaheim
Discover More: A $150K Income Is ‘Lower Middle Class’ in These High-Cost Cities

33. Boulder, Colorado
2022 total households: 43,658
2017 % of middle class households: 39.5
2022 % of middle class households: 36.1
5-year change: -8.61%
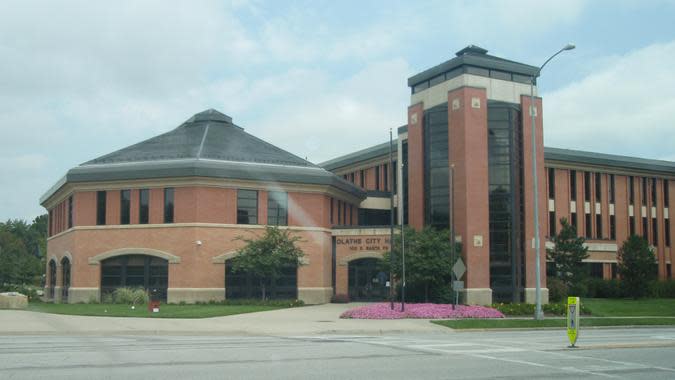
32. Olathe, Kansas
2022 total households: 51,021
2017 % of middle class households: 54.1
2022 % of middle class households: 49.4
5-year change: -8.69%
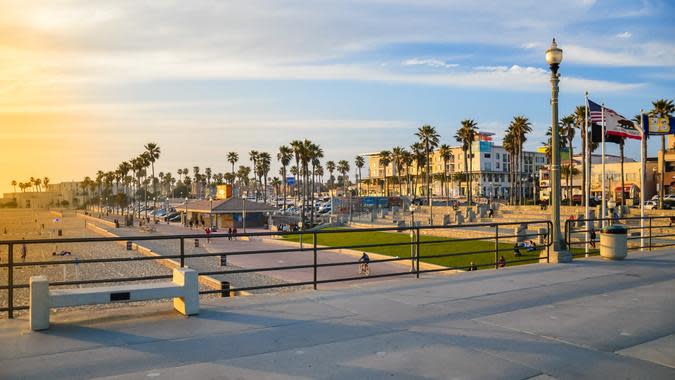
31. Huntington Beach, California
2022 total households: 77,641
2017 % of middle class households: 49.3
2022 % of middle class households: 44.5
5-year change: -9.74%
30. Elk Grove, California
2022 total households: 54,813
2017 % of middle class households: 53.2
2022 % of middle class households: 47.9
5-year change: -9.96%
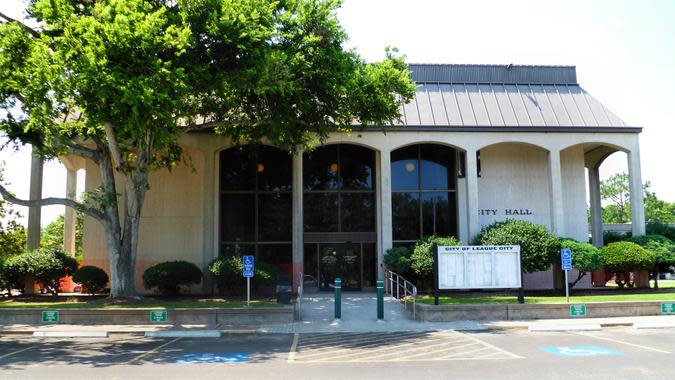
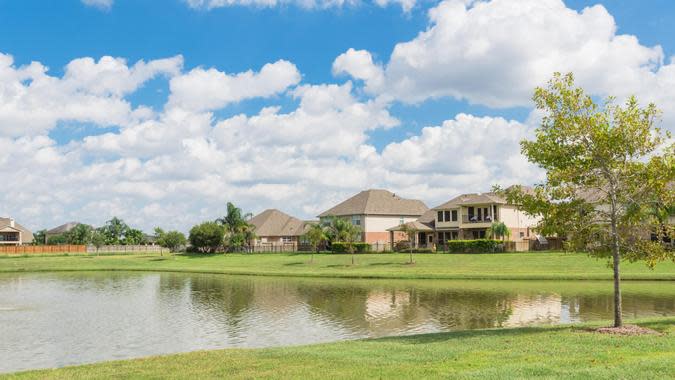
29. League City, Texas
2022 total households: 41,838
2017 % of middle class households: 52.6
2022 % of middle class households: 47.2
5-year change: -10.27%
For You: 7 Popular Clothing Brands the Middle Class Can’t Afford Anymore
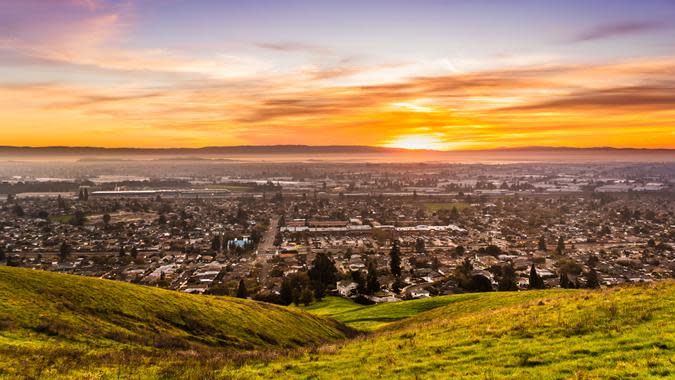
28. Hayward, California
2022 total households: 49,542
2017 % of middle class households: 51.5
2022 % of middle class households: 46.2
5-year change: -10.29%
27. Pasadena, California
2022 total households: 56,076
2017 % of middle class households: 44.5
2022 % of middle class households: 39.6
5-year change: -11.01%
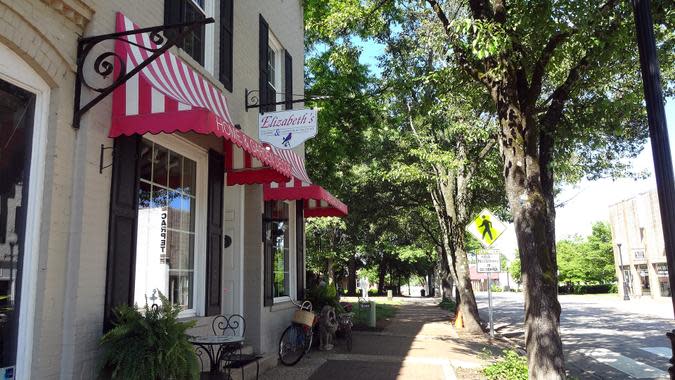
26. Cambridge, Massachusetts
2022 total households: 49,475
2017 % of middle class households: 41.2
2022 % of middle class households: 36.5
5-year change: -11.41%
25. Cary, North Carolina
2022 total households: 66,120
2017 % of middle class households: 47.8
2022 % of middle class households: 42.3
5-year change: -11.51%

24. Roseville, California
2022 total households: 56,133
2017 % of middle class households: 50.4
2022 % of middle class households: 44.5
5-year change: -11.71%
Check Out: 6 Industries That Won’t Exist by 2040

23. Berkeley, California
2022 total households: 45,788
2017 % of middle class households: 38
2022 % of middle class households: 33.3
5-year change: -12.37%
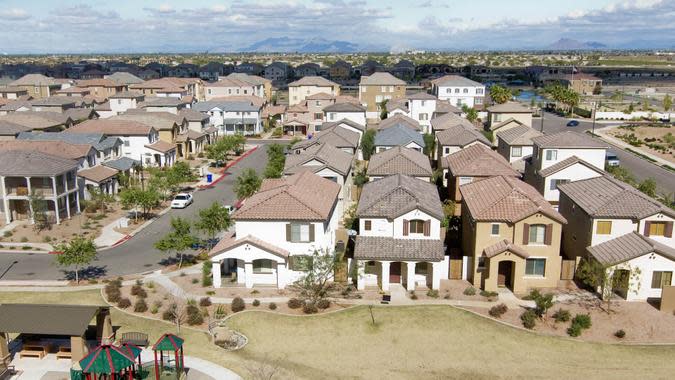
23. Gilbert, Arizona
2022 total households: 90,299
2017 % of middle class households: 57.3
2022 % of middle class households: 49.7
5-year change: -13.26%
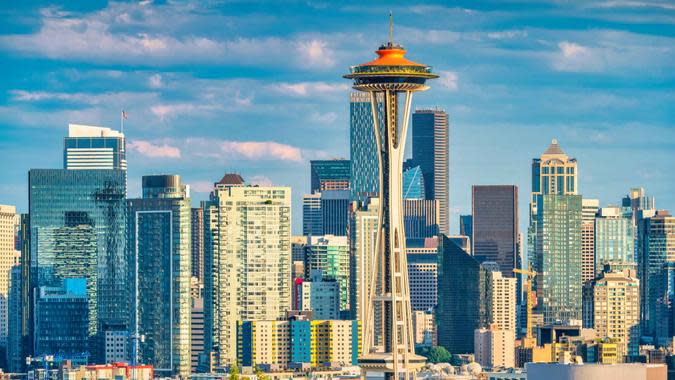
21. Seattle
2022 total households: 345,246
2017 % of middle class households: 44.3
2022 % of middle class households: 38.4
5-year change: -13.32%
20. Pearland, Texas
2022 total households: 42,451
2017 % of middle class households: 55.5
2022 % of middle class households: 48.1
5-year change: -13.33%
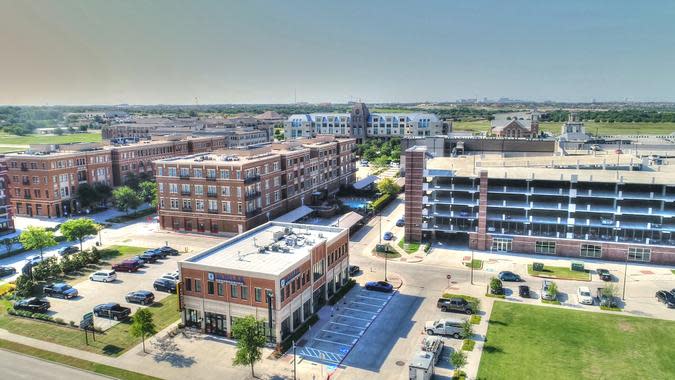
19. Frisco, Texas
2022 total households: 70,502
2017 % of middle class households: 45.2
2022 % of middle class households: 39.1
5-year change: -13.50%
18. Simi Valley, California
2022 total households: 43,936
2017 % of middle class households: 50.9
2022 % of middle class households: 43.8
5-year change: -13.95%

17. Arlington, Virginia
2022 total households: 110,887
2017 % of middle class households: 45.7
2022 % of middle class households: 39.2
5-year change: -14.22%
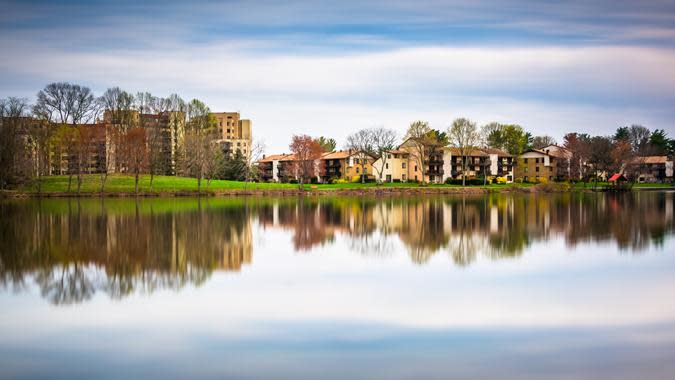
16. Columbia, Maryland
2022 total households: 41,077
2017 % of middle class households: 50.6
2022 % of middle class households: 43.4
5-year change: -14.23%
15. Concord, California
2022 total households: 45,574
2017 % of middle class households: 52.5
2022 % of middle class households: 44.7
5-year change: -14.86%
14. Thousand Oaks, California
2022 total households: 46,143
2017 % of middle class households: 45.5
2022 % of middle class households: 38.4
5-year change: -15.60%
Learn More: Here’s What the US Minimum Wage Was the Year You Were Born
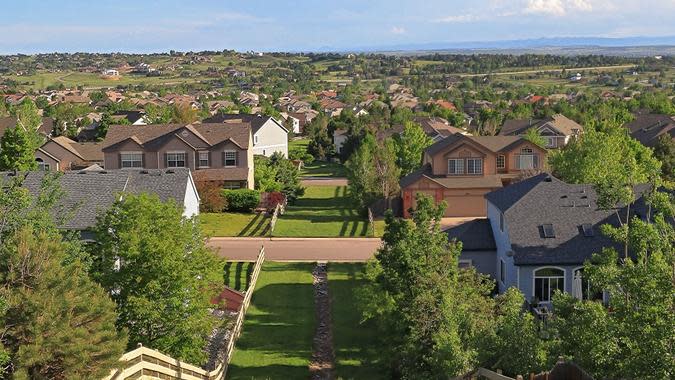
13. Centennial, Colorado
2022 total households: 40,952
2017 % of middle class households: 54.8
2022 % of middle class households: 46.1
5-year change: -15.88%
12. McKinney, Texas
2022 total households: 68,224
2017 % of middle class households: 52.4
2022 % of middle class households: 44.0
5-year change: -16.03%
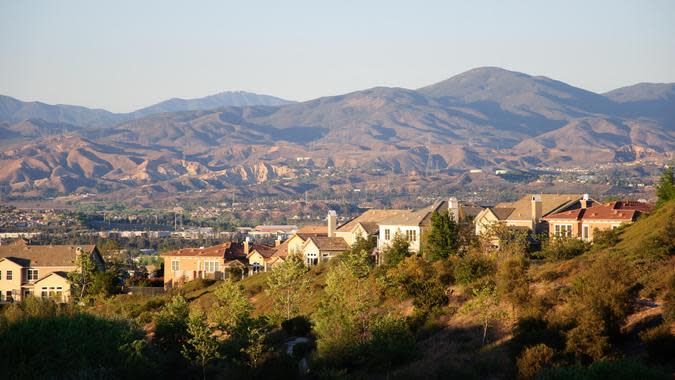
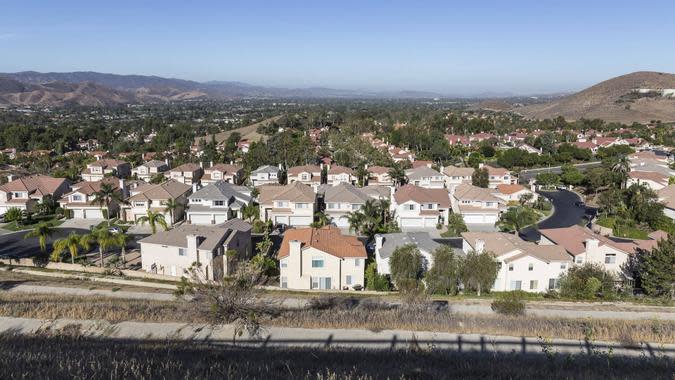
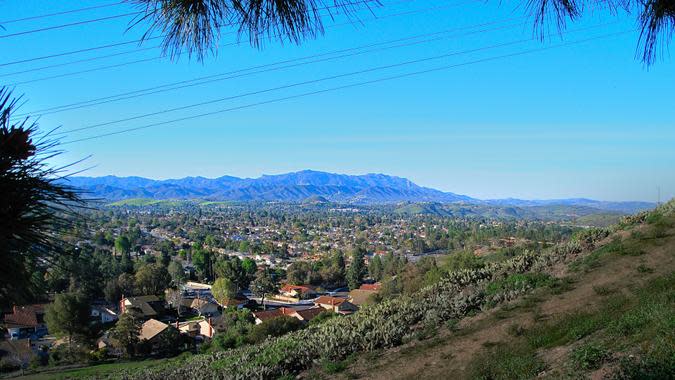
11. Santa Clarita, California
2022 total households: 73,362
2017 % of middle class households: 51.6
2022 % of middle class households: 43.2
5-year change: -16.28%
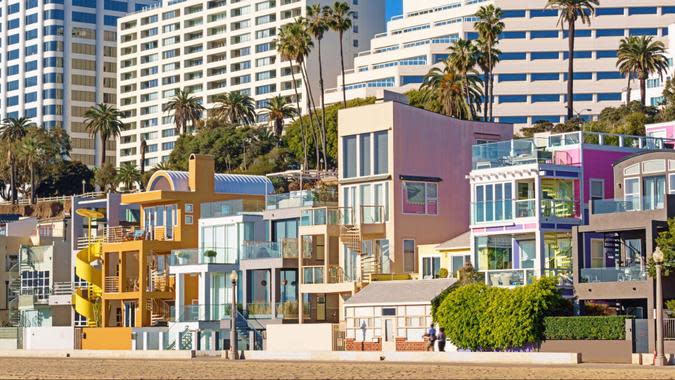
10. Santa Monica, California
2022 total households: 46,207
2017 % of middle class households: 41.3
2022 % of middle class households: 34.3
5-year change: -16.95%

9. San Jose
2022 total households: 324,842
2017 % of middle class households: 43.4
2022 % of middle class households: 36.0
5-year change: -17.05%
Explore More: 7 Things To Know If You Withdraw More Than $10,000 From Your Checking Account
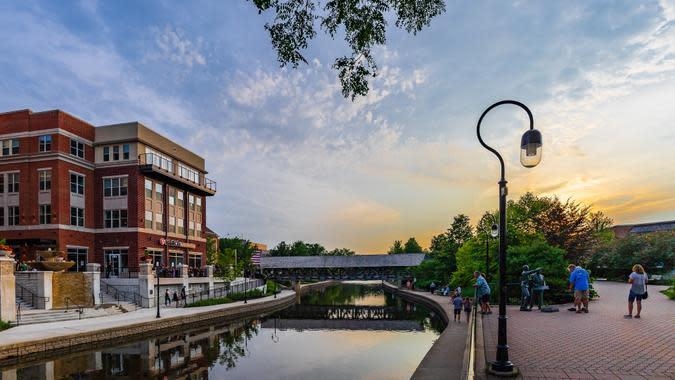
8. Naperville, Illinois
2022 total households: 53,815
2017 % of middle class households: 44.7
2022 % of middle class households: 36.9
5-year change: -17.45%

7. San Francisco
2022 total households: 360,842
2017 % of middle class households: 37.5
2022 % of middle class households: 30.6
5-year change: -18.40%
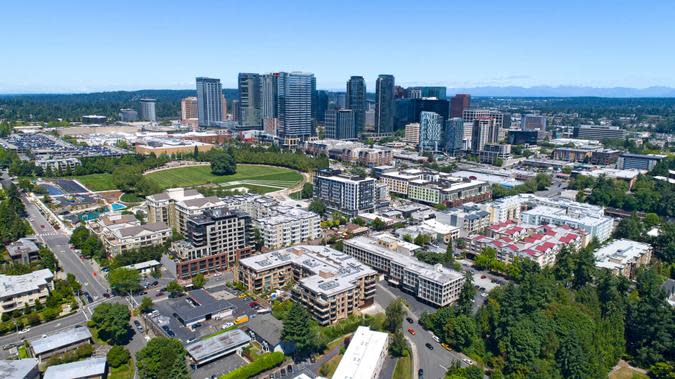
6. Bellevue, Washington
2022 total households: 60,882
2017 % of middle class households: 43.1
2022 % of middle class households: 34.9
5-year change: -19.03%
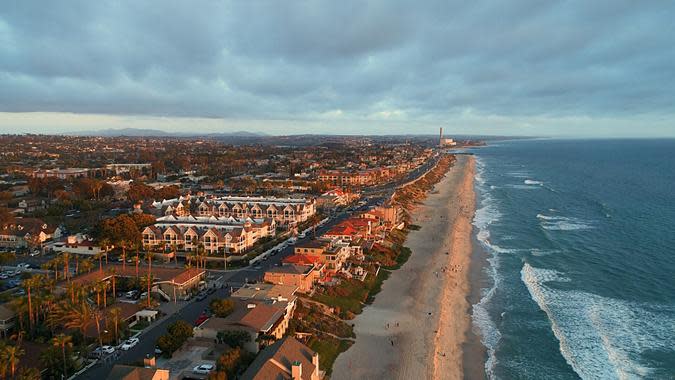
5. Carlsbad, California
2022 total households: 43,912
2017 % of middle class households: 44.5
2022 % of middle class households: 35.4
5-year change: -20.45%
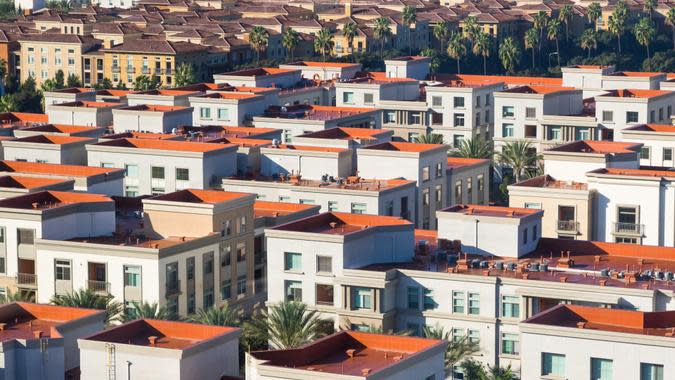
4. Irvine, California
2022 total households: 110,465
2017 % of middle class households: 44.6
2022 % of middle class households: 35.3
5-year change: -20.85%
Read More: 9 Bills Frugal People Don’t Pay
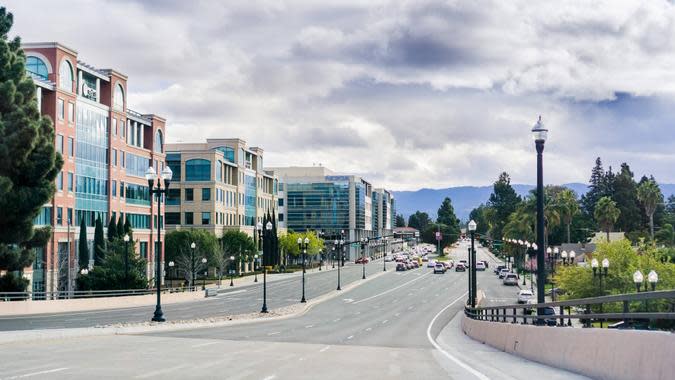
3. Sunnyvale, California
2022 total households: 58,646
2017 % of middle class households: 39.8
2022 % of middle class households: 31.4
5-year change: -21.11%
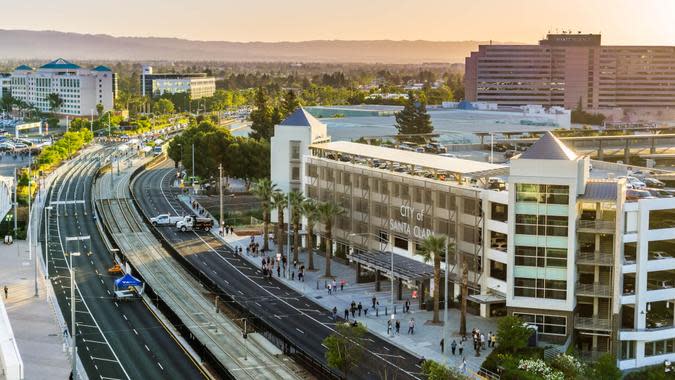
2. Santa Clara, California
2022 total households: 47,434
2017 % of middle class households: 43.4
2022 % of middle class households: 30.7
5-year change: -29.26%
1. Fremont, California
2022 total households: 74,995
2017 % of middle class households: 44.7
2022 % of middle class households: 31.1
5-year change: -30.43%
Methodology: GOBankingRates looked at all United States cities with at least 40,000 households, as sourced from the 2022 American Community Survey, in order to find the 50 cities where the middle class has shrunk the most. GOBankingRates found which percent of each city’s households in 2022 would be considered middle class (earning between $50,000 and $150,000). The cities were ranked on 5-year change in percentage of middle-class households (2017-22). The 50 cities with the greatest decrease change were included in the final rankings. This was the only ranking factor and all data was collected from the 2017 and 2022 American Community Surveys conducted by the United States Census Bureau. Supplemental data for each city was found on the 5-year change in households making $50,000 to $74,999, $75,000 to $99,999 and $100,000 to $149,999. All data was compiled on and up to date as of April 11, 2024.
More From GOBankingRates
How Much Does the Average Middle-Class Person Have in Savings?
5 Reasons You Should Consider an Annuity For Your Retirement Savings
This article originally appeared on GOBankingRates.com: America’s Middle Class Is Shrinking the Most in These 50 Cities
