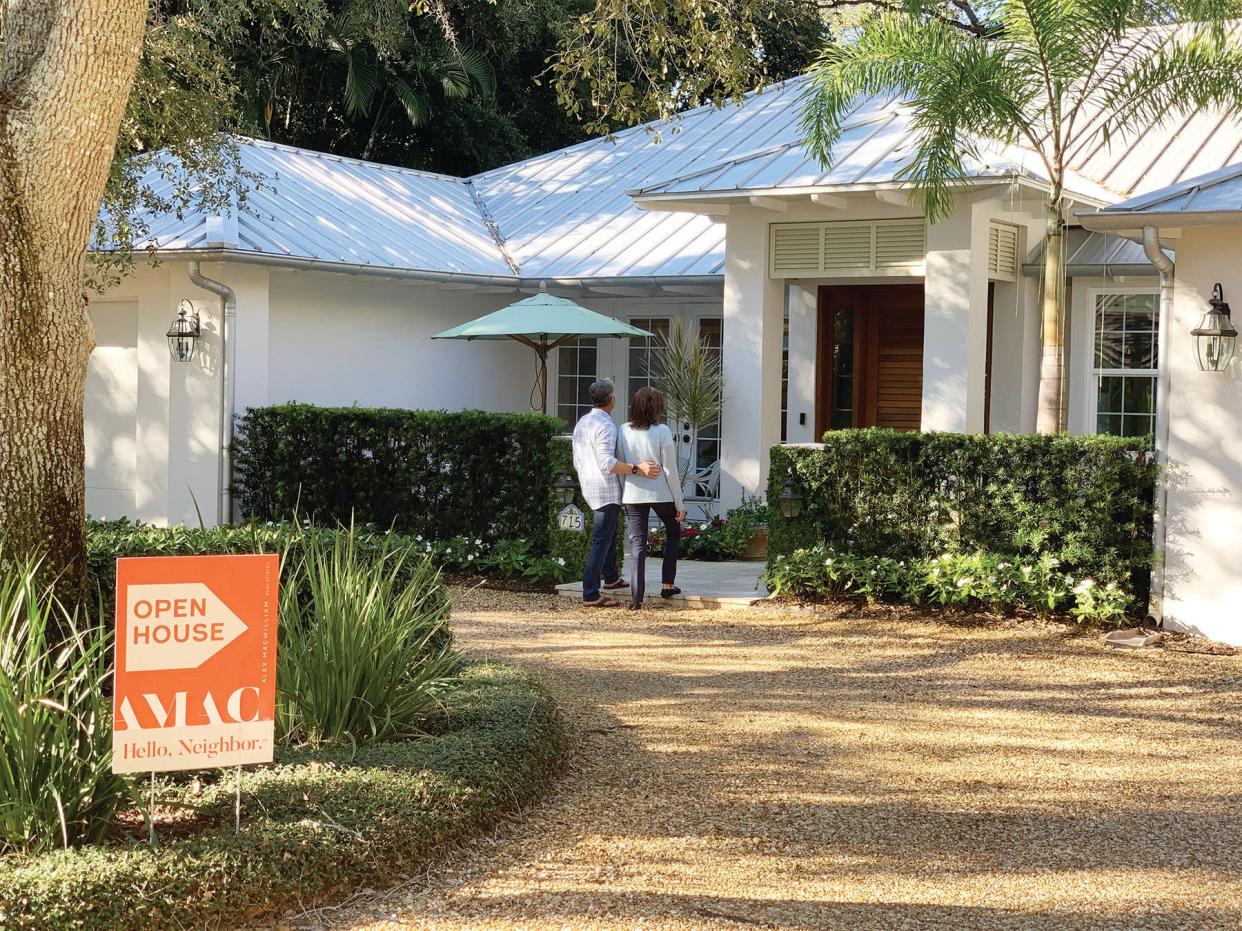
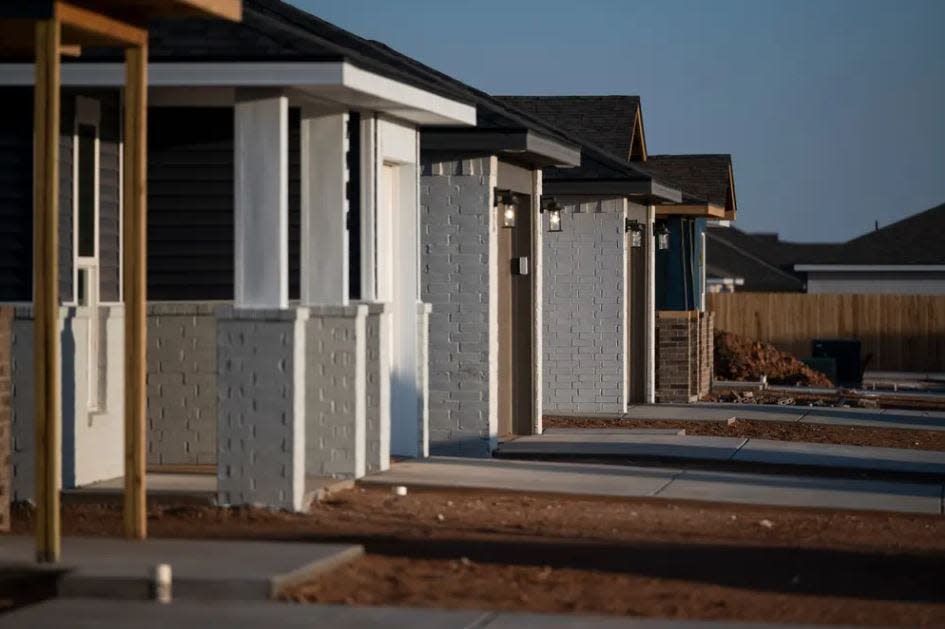
Affordable housing: St. Lucie was first in Florida and third in U.S. for worst decline
St. Lucie County was first in Florida and third in the U.S. for this year’s worst decline in housing affordability since 2005, according to a property and real estate data provider’s study.
That was among 36 Florida counties and 590 U.S. counties, nearly 98% of which were less affordable in the first three months of this year, according to the U.S. Home Affordability Index ATTOM released in March.
Treasure Coast homeownership was less affordable — and “seriously unaffordable” for average workers — in 2024's first quarter compared to historical averages, the study says. But only in St. Lucie did homeownership costs increase faster than average workers' wages.
Over the past 19 years, Treasure Coast homeownership was most affordable in 2012’s first quarter. It was least affordable in St. Lucie in 2023’s last quarter and in Martin and Indian River in 2006’s second quarter. But affordability is improving, said ATTOM CEO Rob Barber.
“It’s not like things are coming up roses for house hunters. Affording a home remains a financial stretch, or a pipe dream, for so many households,” Barber said in a news release, but “the picture for homebuyers is brightening a little again as affordability measures have improved for the second quarter in a row.”
Treasure Coast home affordability
Lenders prefer borrowers not spend over 28% of their annual wages on the mortgage, property taxes, home insurance and mortgage insurance for a median-priced house. The Treasure Coast’s expense-to-wage ratio has increased from an average 18% to 46% since the market was most affordable in 2012.
Homeownership consumed this amount of wages this year:
St. Lucie: 52% compared to 29% historical average, from low of 15% to high of 54%
Indian River: 44% compared to 29% historical average, from low of 17% to high of 47%
Martin: 50% compared to 37% historical average, from low of 21% to high of 64%
That was higher than the 32% national average and the 43% seen in a third of the counties studied, mostly in New York, California and Hawaii.
The study compared wages with the annual salary needed to buy a median-priced home:
St. Lucie: $380,000 home required $94,705, but the average worker made only $51,311
Indian River: $371,250 home required $87,485, but the average worker made only $55,471
Martin: $424,500 home required $101,232, but the average worker made only $56,277
Here’s how much home prices and wages have increased since the market was most affordable in 2012:
St. Lucie County: 332% for home prices vs. 46% for wages
Indian River: 263% for home prices vs. 54% for wages
Martin County: 203% for home prices vs. 42% for wages
“The latest trend continues a pattern, dating back to 2022, of homeownership requiring historically large portions of wages around the country,” the study says. “But with mortgage rates coming down and home prices growing only by modest amounts, it’s gotten a bit easier for average wage earners to afford a home so far this year.”
ATTOM U.S. Home Affordability Index methodology
Here’s how ATTOM determined affordability and assigned each county an index number:
Calculated the amount of income needed to cover homeownership costs on median-priced, single-family homes and condos, taken from publicly recorded sales deed data
Compared that to annualized average weekly wage data for average wage earners from the Bureau of Labor Statistics
Assumed a 20% down payment and 30-year fixed mortgage
Limited it to counties with at least 100,000 residents, 50 first-quarter home sales and sufficient data to analyze.
Here’s how much the indeces have worsened since 2012. Remember, the lower the index number, the more affordability declined. Under 100 means it was less affordable compared to 2005:
St. Lucie: From 192 to 56
Martin: From 177 to 74
Indian River: From 170 to 66
The only counties where affordability declined more than St. Lucie this year were Linn in Iowa and Jasper in Missouri.
Counties that were more affordable than their historical averages were:
Jefferson County, Alabama (Birmingham)
Macon County, Illinois (Decatur)
New York County, New York (Manhattan)
Midland County, Texas
San Francisco County, California
Counties where wages increased more than housing prices, or at least declined less, were:
Harris County, Texas (Houston)
Dallas County, Texas
Tarrant County, Texas (Fort Worth)
Bexar County, Texas (San Antonio)
Alameda County, California (Oakland)
Counties where homeownership costs required the least percentage of wages were:
Macon County, Illinois (Decatur)
Schuylkill County, Pennsylvania (outside Allentown)
Jefferson County, Alabama (Birmingham)
Cambria County, Pennsylvania (east of Pittsburgh)
Peoria County, Illinios
Ananya Tiwari is a business reporter for TCPalm. You can reach her via email at ananya.tiwari@tcpalm.com or follow her work on Facebook, Twitter or X, and MuckRack.
This article originally appeared on Treasure Coast Newspapers: ATTOM affordability index for Stuart, Vero Beach, Fort Pierce, PSL
