30 Most Affordable Downtowns To Live In Across America

When it comes to living costs, America’s 30 most populous downtowns are far from equal.
Read Next: How Far a $100,000 Salary Goes in America’s 50 Largest Cities
Learn More: How To Get $340 Per Year in Cash Back on Gas and Other Things You Already Buy
To rank the nation’s 30 largest downtowns from least to most affordable, GOBankingRates researched the most populous zip codes in downtown areas and scored them based on each city’s cost of living, median household income, median rent, average basic utilities cost and average monthly transportation costs.
When reviewing each city’s overall cost-of-living index, keep in mind that the national median score is 100. The higher a city’s overall cost-of-living index is over 100, the less affordable it is.
You may not be surprised to see that the three least affordable downtowns — and four of the top seven least affordable — are located in notoriously expensive California. Four of the 11 least expensive downtowns can be found in Texas. Here are the final rankings.

30. San Francisco
Total city population: 851,036
Overall cost-of-living index: 245.50
Total score factoring in all expenses: 0.8750
Find Out: Here’s What the US Minimum Wage Was the Year You Were Born
Trending Now: Net Worth for Baby Boomers: How To Tell Whether You’re Poor, Middle Class, Upper Middle Class or Rich

29. San Jose, California
Total city population: 1,001,176
Overall cost-of-living index: 231.00
Total score factoring in all expenses: 0.9688
For You: What Income Level Is Considered Middle Class in Your State?

28. San Diego
Total city population: 1,383,987
Overall cost-of-living index: 154.90
Total score factoring in all expenses: 1.2759

27. New York
Total city population: 8,622,467
Overall cost-of-living index: 172.50
Total score factoring in all expenses: 1.3549

26. Boston
Total city population: 665,945
Overall cost-of-living index: 150.80
Total score factoring in all expenses: 1.6200

25. Seattle
Total city population: 734,603
Overall cost-of-living index: 158.10
Total score factoring in all expenses: 1.8922
Be Aware: 7 Ways the Upper Middle Class Can Become Rich in 2024

24. Los Angeles
Total city population: 3,881,041
Overall cost-of-living index: 161.70
Total score factoring in all expenses: 1.9752

23. Portland, Oregon
Total city population: 646,101
Overall cost-of-living index: 127.70
Total score factoring in all expenses: 2.1615

22. Denver
Total city population: 710,800
Overall cost-of-living index: 127.60
Total score factoring in all expenses: 2.2981

21. Washington, D.C.
Total city population: 670,587
Overall cost-of-living index: 151.90
Total score factoring in all expenses: 2.3291
Discover More: 7 Things the Middle Class Won’t Be Able To Afford in the Next 5 Years

20. Dallas
Total city population: 1,300,642
Overall cost-of-living index: 100.20
Total score factoring in all expenses: 2.5040

19. Charlotte, North Carolina
Total city population: 875,045
Overall cost-of-living index: 102.50
Total score factoring in all expenses: 2.5405

18. Philadelphia
Total city population: 1,593,208
Overall cost-of-living index: 104.30
Total score factoring in all expenses: 2.6262

17. Fort Worth, Texas
Total city population: 924,663
Overall cost-of-living index: 101.50
Total score factoring in all expenses: 2.6673
Check Out: How Much Household Income Will Be Considered Upper Middle Class in 5 Years?

16. Phoenix
Total city population: 1,609,456
Overall cost-of-living index: 113.00
Total score factoring in all expenses: 2.7107

15. Oklahoma City
Total city population: 681,088
Overall cost-of-living index: 85.50
Total score factoring in all expenses: 2.8315

14. Chicago
Total city population: 2,721,914
Overall cost-of-living index: 105.70
Total score factoring in all expenses: 2.8388

13. Indianapolis
Total city population: 882,006
Overall cost-of-living index: 85.70
Total score factoring in all expenses: 2.8443
Trending Now: A $150K Income Is ‘Lower Middle Class’ In These High-Cost Cities

12. Las Vegas
Total city population: 644,835
Overall cost-of-living index: 110.60
Total score factoring in all expenses: 2.8492

11. Austin, Texas
Total city population: 958,202
Overall cost-of-living index: 129.10
Total score factoring in all expenses: 2.8804

10. Houston
Total city population: 2,296,253
Overall cost-of-living index: 96.90
Total score factoring in all expenses: 2.9026

9. Nashville, Tennessee
Total city population: 684,103
Overall cost-of-living index: 104.70
Total score factoring in all expenses: 2.9341
Explore More: Net Worth for US Families: How To Tell if You’re Poor, Middle Class, Upper Middle Class or Rich

8. Detroit
Total city population: 636,787
Overall cost-of-living index: 91.80
Total score factoring in all expenses: 2.9799

7. Columbus, Ohio
Total city population: 902,449
Overall cost-of-living index: 91.40
Total score factoring in all expenses: 3.0261

6. San Antonio
Total city population: 1,445,662
Overall cost-of-living index: 91.30
Total score factoring in all expenses: 3.0984
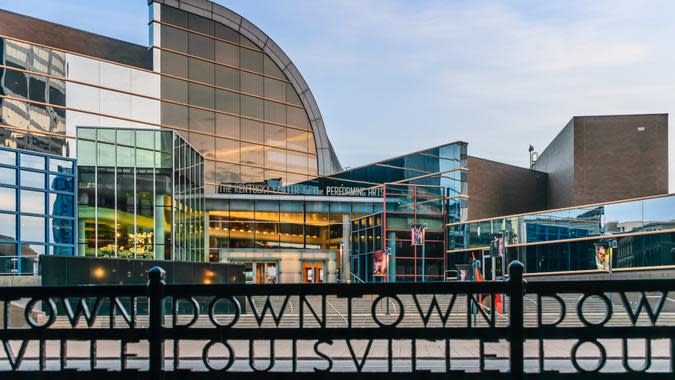
5. Louisville, Kentucky
Total city population: 629,176
Overall cost-of-living index: 89.80
Total score factoring in all expenses: 3.1123
For You: I’m a Financial Advisor: Here’s Why My Rich Clients Identify With the Middle Class

4. El Paso, Texas
Total city population: 677,181
Overall cost-of-living index: 81.90
Total score factoring in all expenses: 3.1222

3. Baltimore
Total city population: 584,548
Overall cost-of-living index: 92.60
Total score factoring in all expenses: 3.2307

2. Jacksonville, Florida
Total city population: 950,203
Overall cost-of-living index: 95.70
Total score factoring in all expenses: 3.4093

1. Memphis, Tennessee
Total city population: 630,027
Overall cost-of-living index: 85.80
Total score factoring in all expenses: 3.4868
Jami Farkas and John Csiszar contributed to the reporting for this article.
Methodology: For this study, GOBankingRates analyzed the top 30 U.S. cities in terms of population as sourced from the U.S. Census Bureau’s American Community Survey. The ZIP code with the most population in each of the cities was recorded, along with the population. Using the RandyMajors.org ZIP Codes Map, the ZIP codes in downtown areas were recorded. For each of those ZIP codes, the total population was determined through the American Community Survey. The cost-of-living index for each city was sourced from Sperlings BestPlaces. The median household income and median rent cost were sourced from the American Community Survey. The average basic utilities cost and average monthly transportation costs were sourced from Numbeo’s Cost of Living. The cost-of-living index, the rent cost, the transportation cost and the utilities cost were each scored and weighted at 1.00. All the scores were summed and sorted to show the most affordable downtowns among U.S. cities with the largest populations. All data was collected on and is up-to-date as-of April 3, 2024.
More From GOBankingRates
This article originally appeared on GOBankingRates.com: 30 Most Affordable Downtowns To Live In Across America
