30 Cheap Cities You’ll Love To Live In

Whether you’re just starting, already in retirement – or at any point in between — your financial well-being can be impacted greatly by your city’s cost of living. Even with a high income or plenty of retirement savings, it can be tough to get by where costs are high. More affordable cities, meanwhile, can make it easier to get ahead financially.
Do You Have a Money Question? Ask an Expert
Learn: 3 Things You Must Do When Your Savings Reach $50,000
But living in a cheap city can come with trade-offs — such as a lack of amenities, struggling school districts or even higher crime rates. To identify affordable places where you can get ahead financially without sacrificing the quality of life, GOBankingRates analyzed U.S. cities that have populations of at least 100,000 and factored in other things people take into account when deciding where to live.
Keep reading to find out where to live to enjoy a good quality of life and save money on your monthly expenses and bills.
30. Independence, Missouri
Total population: 122,230
Median household income: $53,996
Average home value, January 2023: $177,135
Livability: 71
Violent crime rate: 5.52
Property crime rate: 35.88
Overall cost of living: 85.5
Annual expenditure: $57,223
Take Our Poll: Are You Concerned About the Safety of Your Money in Your Bank Accounts?
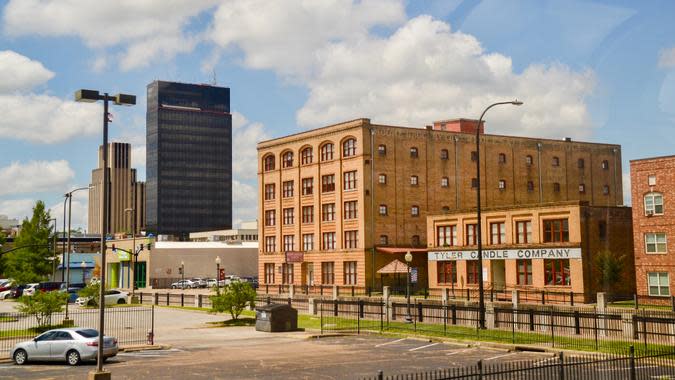
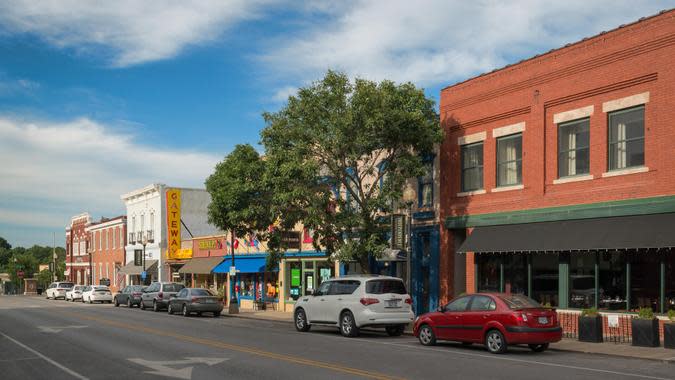
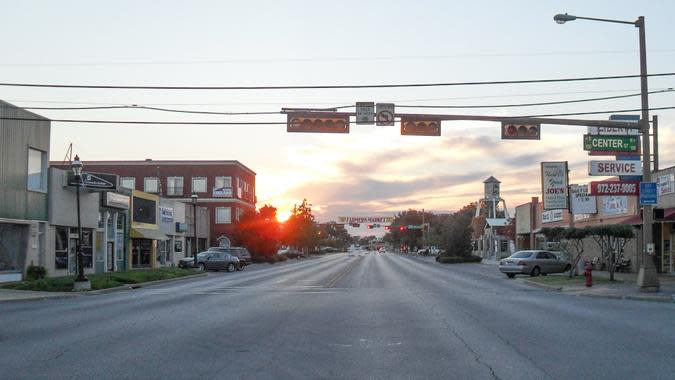
29. Tyler, Texas
Total population: 104,945
Median household income: $58,385
Average home value, January 2023: $222,562
Livability: 70
Violent crime rate: 4.50
Property crime rate: 26.44
Overall cost of living: 82.8
Annual expenditure: $55,416

28. Lexington, Kentucky
Total population: 321,354
Median household income: $61,526
Average home value, January 2023: $263,350
Livability: 76
Violent crime rate: 3.04
Property crime rate: 29.35
Overall cost of living: 90.5
Annual expenditure: $60,570
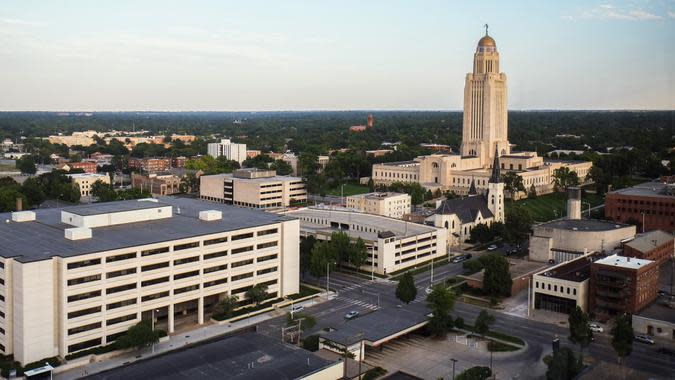
27. Lincoln, Nebraska
Median household income: $51,408
Average home value, 2021: $214,342
Livability: 77
Violent crime rate: 3.43
Property crime rate: 17.14
Overall cost of living: 89.9
Annual expenditure: $55,512.35
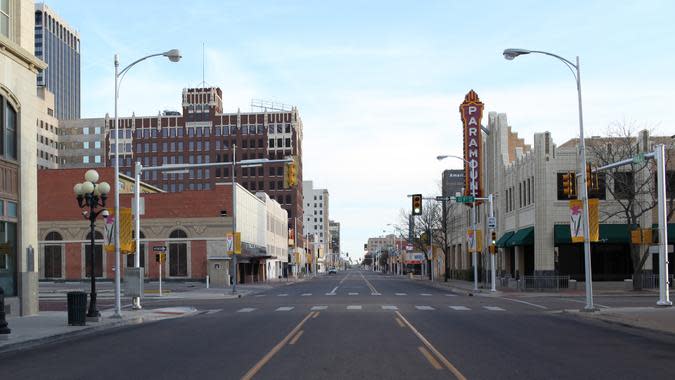
26. Amarillo, Texas
Total population: 200,371
Median household income: $55,174
Average home value, January 2023: $181,193
Livability: 73
Violent crime rate: 7.46
Property crime rate: 33.71
Overall cost of living: 77.8
Annual expenditure: $52,070
25. Grand Prairie, Texas
Total population: 195,992
Median household income: $73,352
Average home value, January 2023: $310,799
Livability: 80
Violent crime rate: 2.19
Property crime rate: 17.39
Overall cost of living: 101.1
Annual expenditure: $67,664
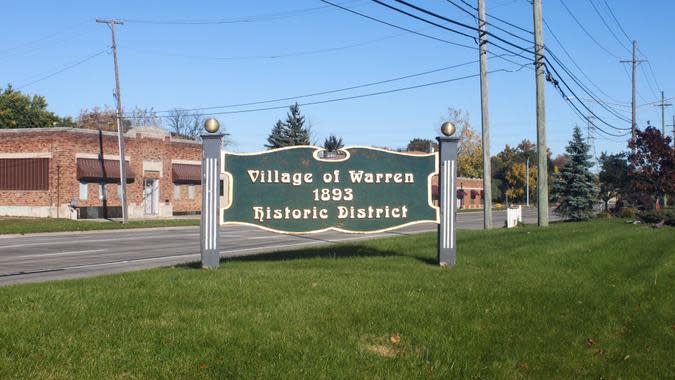
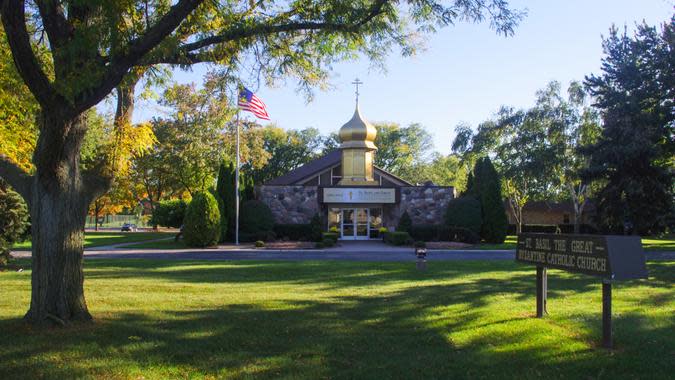
24. Warren, Michigan
Total population: 138,996
Median household income: $55,153
Average home value, January 2023: $184,946
Livability: 70
Violent crime rate: 5.24
Property crime rate: 15.61
Overall cost of living: 92.8
Annual expenditure: $62,109

23. Hampton, Virginia
Total population: 136,748
Median household income: $59,380
Average home value, January 2023: $233,401
Livability: 72
Violent crime rate: 2.87
Property crime rate: 24.99
Overall cost of living: 88
Annual expenditure: $58,897
22. Norman, Oklahoma
Total population: 125,745
Median household income: $59,866
Average home value, January 2023: $227,192
Livability: 76
Violent crime rate: 3.17
Property crime rate: 31.23
Overall cost of living: 87
Annual expenditure: $58,227
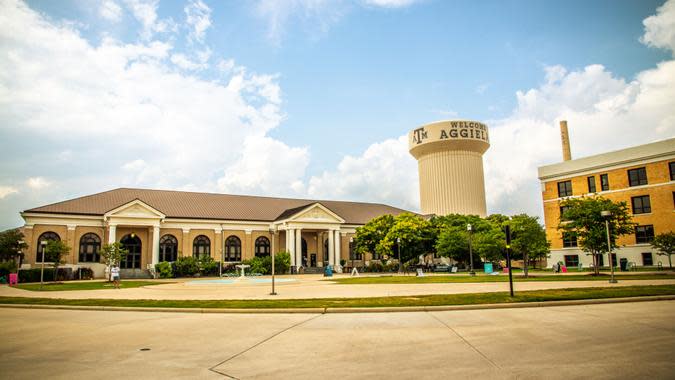
21. College Station, Texas
Total population: 116,276
Median household income: $50,089
Average home value, January 2023: $316,722
Livability: 79
Violent crime rate: 1.97
Property crime rate: 20.71
Overall cost of living: 88.5
Annual expenditure: $59,231
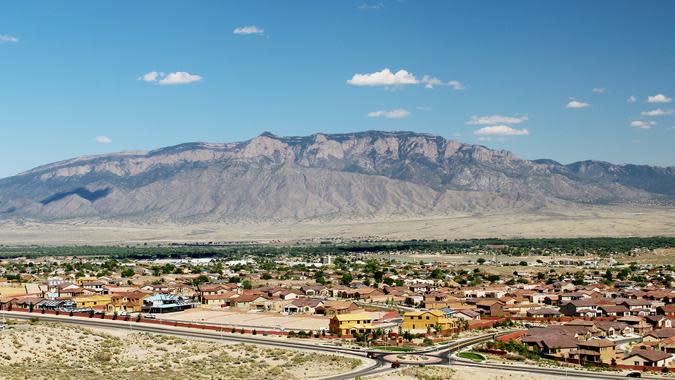
20. Rio Rancho, New Mexico
Total population: 102,403
Median household income: $70,615
Average home value, January 2023: $299,638
Livability: 78
Violent crime rate: 1.88
Property crime rate: 15.05
Overall cost of living: 94
Annual expenditure: $62,912
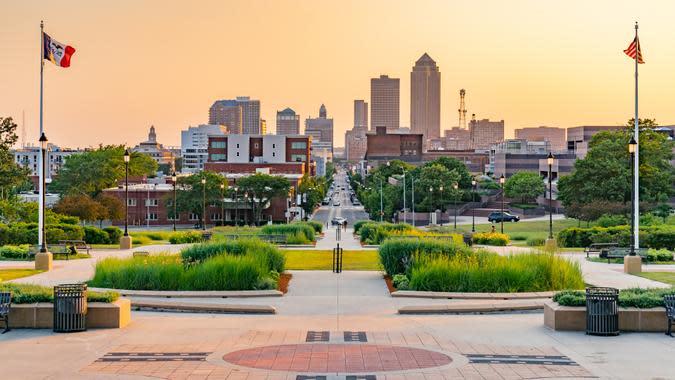
19. Des Moines, Iowa
Total population: 213,545
Median household income: $58,444
Average home value, January 2023: $179,879
Livability: 75
Violent crime rate: 6.32
Property crime rate: 31.89
Overall cost of living: 78.7
Annual expenditure: $52,672

18. Joliet, Illinois
Total population: 150,323
Median household income: $77,373
Average home value, January 2023: $205,688
Livability: 70
Violent crime rate: 5.05
Property crime rate: 11.51
Overall cost of living: 84.1
Annual expenditure: $56,286

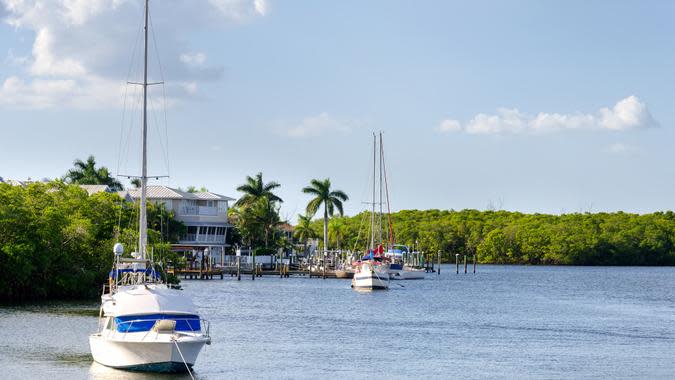
17. Lakeland, Florida
Total population: 110,401
Median household income: $52,972
Average home value, January 2023: $279,678
Livability: 82
Violent crime rate: 3.68
Property crime rate: 24.02
Overall cost of living: 88.3
Annual expenditure: $59,097

16. Dearborn, Michigan
Total population: 107,985
Median household income: $60,184
Average home value, January 2023: $201,400
Livability: 75
Violent crime rate: 3.35
Property crime rate: 16.28
Overall cost of living: 95.7
Annual expenditure: $64,050
15. Green Bay, Wisconsin
Total population: 107,083
Median household income: $55,221
Average home value, January 2023: $206,384
Livability: 70
Violent crime rate: 4.54
Property crime rate: 15.22
Overall cost of living: 80.3
Annual expenditure: $53,743
14. Palm Bay, Florida
Total population: 118,709
Median household income: $55,963
Average home value, January 2023: $300,135
Livability: 80
Violent crime rate: 2.81
Property crime rate: 14.13
Overall cost of living: 90.4
Annual expenditure: $60,503

13. Rochester, Minnesota
Total population: 119,732
Median household income: $79,159
Average home value, January 2023: $302,864
Livability: 85
Violent crime rate: 2.93
Property crime rate: 19.37
Overall cost of living: 92.5
Annual expenditure: $61,908

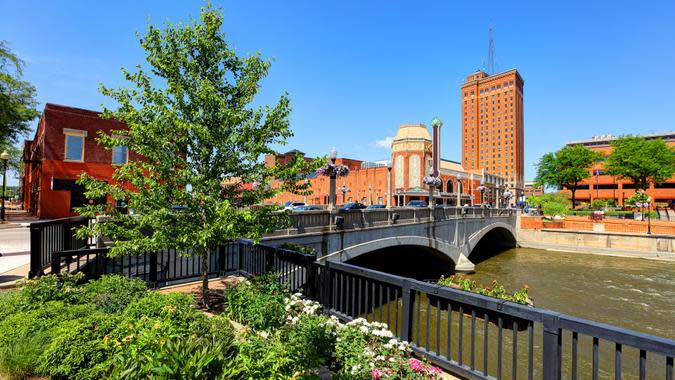
12. Elgin, Illinois
Total population: 114,156
Median household income: $79,757
Average home value, January 2023: $269,339
Livability: 77
Violent crime rate: 2.12
Property crime rate: 10.13
Overall cost of living: 91.6
Annual expenditure: $61,306
11. Sterling Heights, Michigan
Total population: 134,062
Median household income: $70,211
Average home value, January 2023: $279,667
Livability: 82
Violent crime rate: 1.85
Property crime rate: 8.40
Overall cost of living: 101.5
Annual expenditure: $67,932
10. Aurora, Illinois
Total population: 183,447
Median household income: $79,642
Average home value, January 2023: $254,418
Livability: 77
Violent crime rate: 3.39
Property crime rate: 8.21
Overall cost of living: 89.1
Annual expenditure: $59,633

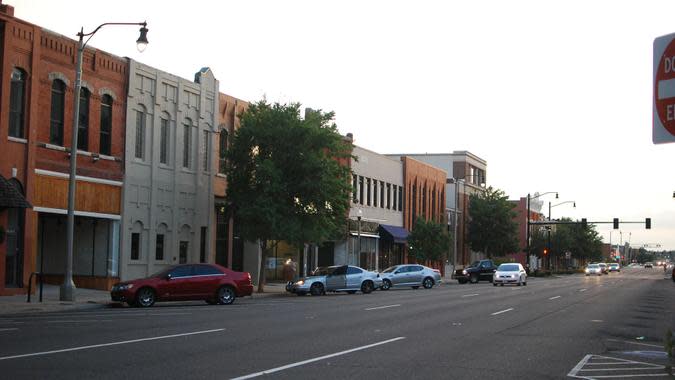
9. Wichita Falls, Texas
Total population: 102,563
Median household income: $50,856
Average home value, January 2023: $147,753
Livability: 75
Violent crime rate: 5.82
Property crime rate: 31.59
Overall cost of living: 75.7
Annual expenditure: $50,664
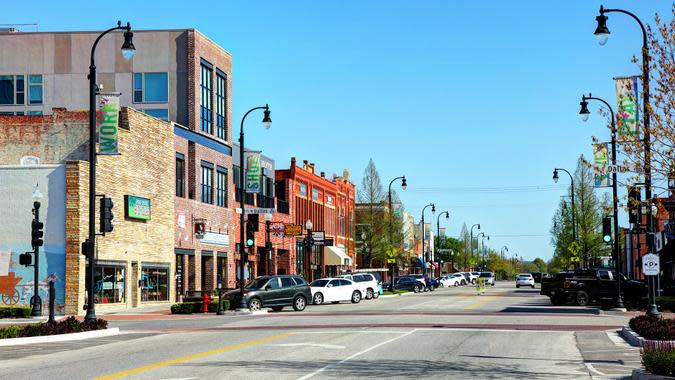
8. Broken Arrow, Oklahoma
Total population: 112,751
Median household income: $76,733
Average home value, January 2023: $246,072
Livability: 79
Violent crime rate: 1.52
Property crime rate: 18.53
Overall cost of living: 89.3
Annual expenditure: $59,767

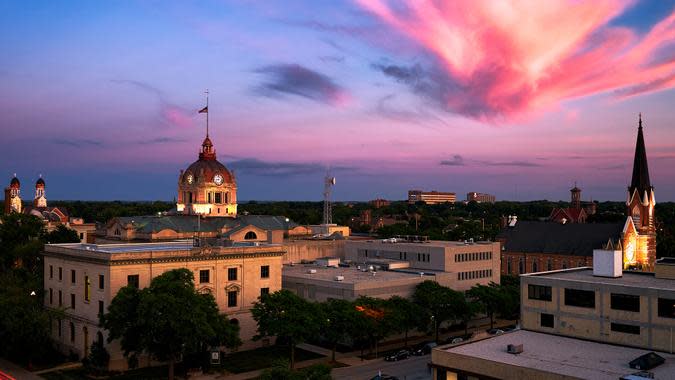
7. Cedar Rapids, Iowa
Total population: 136,512
Median household income: $63,170
Average home value, January 2023: $187,941
Livability: 76
Violent crime rate: 3.41
Property crime rate: 26.78
Overall cost of living: 79.2
Annual expenditure: $53,007
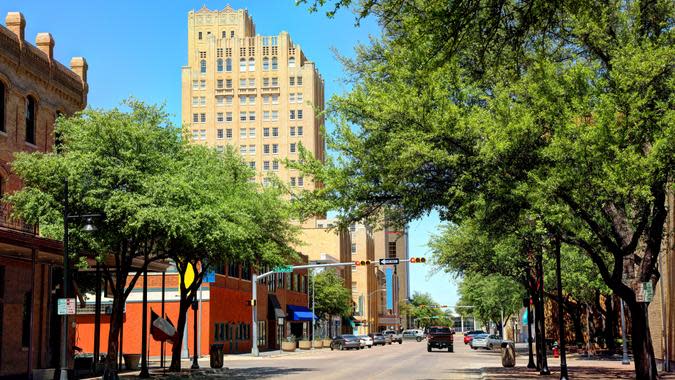
6. Abilene, Texas
Total population: 125,474
Median household income: $54,493
Average home value, January 2023: $174,950
Livability: 75
Violent crime rate: 4.78
Property crime rate: 20.68
Overall cost of living: 79.3
Annual expenditure: $53,074

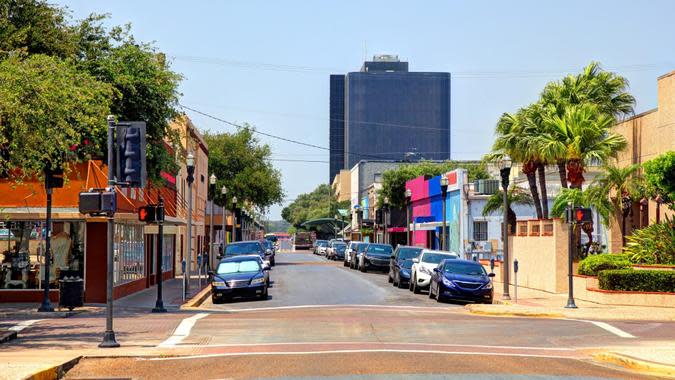
5. Laredo, Texas
Total population: 254,697
Median household income: $55,603
Average home value, January 2023: $196,466
Livability: 72
Violent crime rate: 3.15
Property crime rate: 12.37
Overall cost of living: 82
Annual expenditure: $54,881

4. Fort Wayne, Indiana
Total population: 262,676
Median household income: $53,978
Average home value, January 2023: $195,509
Livability: 75
Violent crime rate: 2.64
Property crime rate: 23.13
Overall cost of living: 80.6
Annual expenditure: $53,944
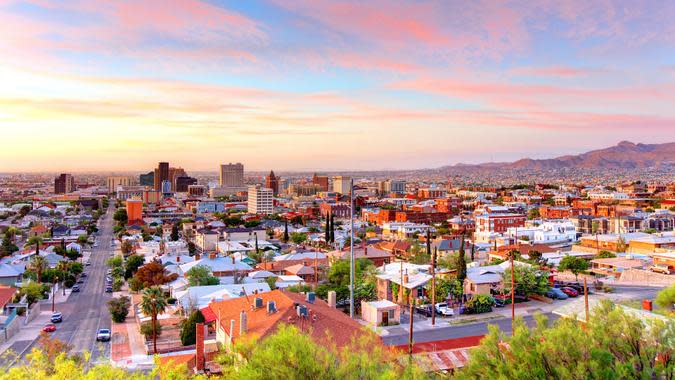
3. El Paso, Texas
Total population: 676,395
Median household income: $51,325
Average home value, January 2023: $190,159
Livability: 74
Violent crime rate: 2.54
Property crime rate: 12.73
Overall cost of living: 82
Annual expenditure: $54,881
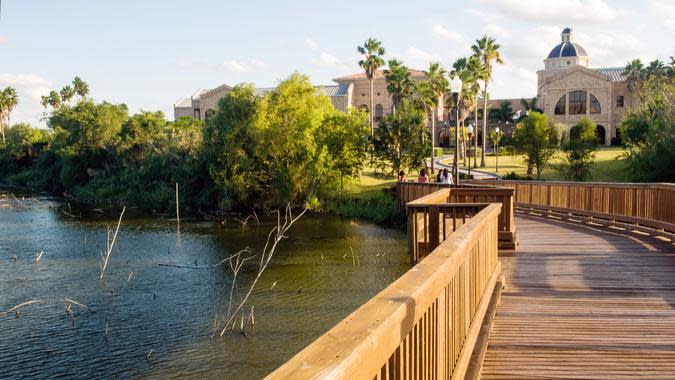
2. Brownsville, Texas
Total population: 185,849
Median household income: $43,174
Average home value, January 2023: $153,842
Livability: 73
Violent crime rate: 3.97
Property crime rate: 18.27
Overall cost of living: 73.4
Annual expenditure: $49,125
1. Wichita Falls, Texas
Total population: 141,941
Median household income: $52,422
Average home value, January 2023: $195,966
Livability: 81
Violent crime rate: 1.82
Property crime rate: 18.27
Overall cost of living: 78.8
Annual expenditure: $52,739
More From GOBankingRates
Robert Kiyosaki Shares 7 Steps To Reach Your Financial Goals
This Mistake Can Tank Your Credit Score 100 Points Overnight
Methodology: GOBankingRates determined cheap cities you’ll love to live in by analyzing U.S. cities with at least 100,000 people along the following criteria: (1) average home value price, based on taking the average home value from the months January 2022 through January 2023 from Zillow’s January 2023 data; this value had to be cheaper than the corresponding value for the U.S. overall, $324,127, in order to be considered as a finalist in the study; (2) livability score, sourced from AreaVibes; (3) violent crime rate per 1,000 residents; (4) property crime rate per 1,000 residents, sourced from NeighborhoodScout; and (5) annual expenditure as sourced from the 2021 Bureau of Labor Statistics Consumer Expenditure Survey and then factored for each city from Sperling’s Best Places cost of living indices. Each factor was scored, then added up for the final ranking. All data compiled on March 6, 2023. Population numbers were sourced from the Census Bureau’s 2021 American Community Survey.
Jami Farkas and Jordan Rosenfeld contributed to the reporting for this article.
This article originally appeared on GOBankingRates.com: 30 Cheap Cities You’ll Love To Live In
