These 22 States Love Playing the Lottery the Most
Who doesn't scratch off a lottery ticket and dream of revealing a $1 million prize? Or listen as the numbers are called on the Powerball game, hoping to be holding the winning $400 million ticket?
The sale of lottery tickets results in billions of dollars each year being pumped into state treasuries to help fund things such as education, senior programs or capital projects. And the games are more popular in some states than in others.
Also: The Minimum Salary You Need To Be Happy in Every State
SNAP Benefits: How Long Do They Last?
With National Lottery Day on July 17, GOBankingRates analyzed 2020 lottery ticket sales and prize data from the U.S. Census Bureau to determine the states where residents most love to play the lottery. When figuring the per capita spending, the total number of residents over age 18.
Nationally, the average spent per person is $316.47, with prizes totaling $184.45 each. One state you won't see on our list is North Dakota. Residents there really don't like playing the lottery, spending an average of only $40 per person a year.
The GOBankingRates study ranks the states from least to most spent per capita annually on lottery tickets and include only the top 22 states. Alabama, Alaska, Hawaii, Nevada and Utah do not have a state lottery system and were excluded from this study. You may be surprised to learn that some of America's smaller states are more willing to gamble the most money away.

Illinois
Annual amount spent on lottery per person: $288.19
Annual lottery prize per person: $186.82
The Illinois Lottery website says the state lottery has contributed more than $20 billion in revenue to the state in its history, with the money supporting education, capital projects and special causes. Citizens of Illinois spent more than $2.84 billion on lottery tickets in 2020.
Take Our Poll: Do You Think You Will Be Able To Retire at Age 65?

Tennessee
Annual amount spent on lottery per person: $295.78
Annual lottery prize per person: $207.44
Tennessee residents spent more than $1.55 billion on lottery tickets in 2020, with the total winnings at nearly $1.1 billion - a return rate of 70.1%.

Texas
Annual amount spent on lottery per person: $299.06
Annual lottery prize per person: $209.01
With $6.36 billion in lottery ticket sales in 2020, Texas took in the fourth-most money among all the states. It paid out $4.44 billion - just a trickle more than California's $4.40 billion.

Missouri
Annual amount spent on lottery per person: $299.92
Annual lottery prize per person: $223.93
Buying a lottery ticket in Missouri is a better bet than in other states. In 2020, Missourians spent $1.42 billion, and $1.06 billion in prizes were paid out - a return of 78% of the money gambled.

Virginia
Annual amount spent on lottery per person: $305.37
Annual lottery prize per person: $198.49
Virginia is the first state on the list with lottery spending of more than $300 per person. Prizes awarded, however, are less than $200 per person.
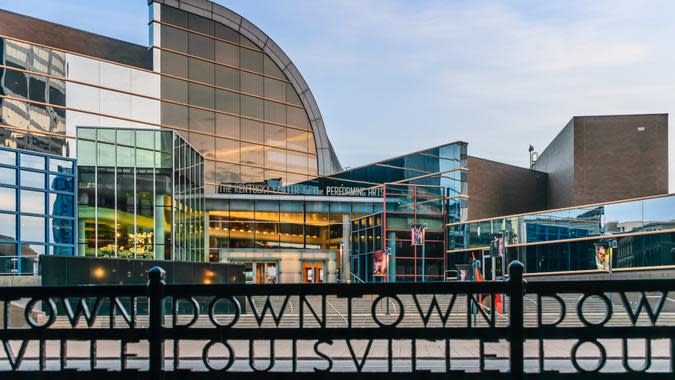
Kentucky
Annual amount spent on lottery per person: $327.82
Annual lottery prize per person: $231.95
Overall lottery winnings in Kentucky totaled $801.24 million against expenditures of $1.13 billion in 2020.

New Hampshire
Annual amount spent on lottery per person: $336.35
Annual lottery prize per person: $224.94
With just 1.1 million residents, New Hampshire took in $369.15 million in lottery sales in 2020. It paid out $246.88 million - 66.9% of the intake.

North Carolina
Annual amount spent on lottery per person: $340.54
Annual lottery prize per person: $242.14
Lottery players in North Carolina fared better than in New Hampshire, with 71.1% of the ticket sales returned in prizes.

Ohio
Annual amount spent on lottery per person: $356.55
Annual lottery prize per person: $248.78
Ohio residents love playing the lottery. According to the state lottery website, the state ranked eighth in the nation in total traditional game sales in the 2021 fiscal year. Ohio instituted its lottery in August 1974.

West Virginia
Annual amount spent on lottery per person: $375.91
Annual lottery prize per person: $88.65
West Virginia's lottery ticket sales are far lower than most other states on this list at $542.14 million because of West Virginia's small population eligible to buy lottery tickets - just 1.44 million. However, only 23.6% of the amount spent on tickets was returned to players in prizes - by far the lowest on this list.

Delaware
Annual amount spent on lottery per person: $396.98
Annual lottery prize per person: $247.86
For such a small state, Delaware residents spend a lot per person on lottery tickets - nearly $400. In all, just over $300 million was spent statewide on the lottery in 2020.

Pennsylvania
Annual amount spent on lottery per person: $408.06
Annual lottery prize per person: $288.56
Pennsylvania says it is the only state that uses all of its lottery proceeds to assist older residents. It has contributed more than $31 billion to programs such as transportation, prescription assistance and senior centers, according to the Pennsylvania Lottery.
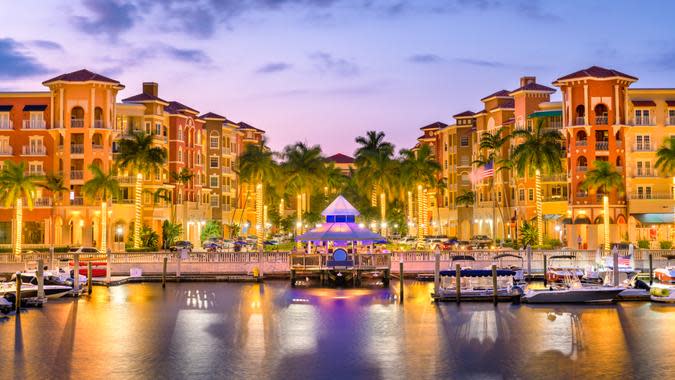
Florida
Annual amount spent on lottery per person: $417.04
Annual lottery prize per person: $295.85
With $7.09 billion in lottery sales, Florida ranks second on the list in total value of tickets sold, thanks to its population of more than 17 million. But it returned the most money in prizes -- $5.03 billion, or 71% of the expenditures.

Maryland
Annual amount spent on lottery per person: $431.36
Annual lottery prize per person: $291.48
Lottery profits primarily support the Maryland general fund and are earmarked for public education, public health and safety services. In the 2021 fiscal year, the lottery contributed a record $667.4 million to state programs, according to the state.

Connecticut
Annual amount spent on lottery per person: $434.71
Annual lottery prize per person: $290.04
Connecticut's lottery money goes to the state's general fund to finance public health, public safety, libraries, education and more. The lottery has added more than $10.6 billion to the general fund since it began in 1972, according to the state. More than $20 billion has been paid out to winners.

New Jersey
Annual amount spent on lottery per person: $437.13
Annual lottery prize per person: $284.13
You don't need to head to Atlantic City to gamble in New Jersey. The lottery is a popular option, with $3.03 billion worth of tickets sold in 2020.
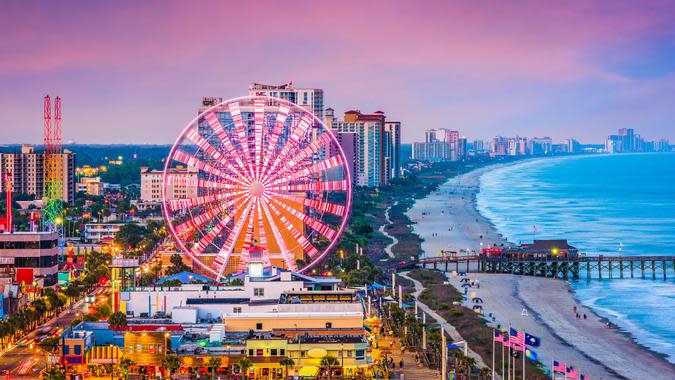
South Carolina
Annual amount spent on lottery per person: $491.64
Annual lottery prize per person: $357.58
South Carolina paid out $1.42 billion of the $1.96 billion it took in during 2020. That's a return of 72.7% -- third highest on the list.

Michigan
Annual amount spent on lottery per person: $492.50
Annual lottery prize per person: $337.94
The beneficiaries of the lottery in Michigan are the schools. The Michigan Lottery began in 1972, and it has contributed more than $26 billion to education in its 50 years, according to lottery statistics.

Rhode Island
Annual amount spent on lottery per person: $503.83
Annual lottery prize per person: $183.87
In Rhode Island, the annual amount spent on lottery tickets per person is the fourth highest on the list. It's payout, however, is the second lowest - a paltry $183.87. That's just 36.5% of the $503.83 spending per person.

New York
Annual amount spent on lottery per person: $539.47
Annual lottery prize per person: $299.38
With a population of more than 15.4 million, it's no wonder New York leads the nation on spending on lottery tickets at $8.33 billion. More than half of that -- $4.62 billion -- was returned in prize money in 2020.

Georgia
Annual amount spent on lottery per person: $542.62
Annual lottery prize per person: $380.16
The state generated about $4.35 billion in ticket sales in 2020. About 70% of it went to prize money.

Massachusetts
Annual amount spent on lottery per person: $951.92
Annual lottery prize per person: $701.50
Massachusetts residents spend over $400 more than residents of Georgia when it comes to buying lottery tickets - a whopping $951.92 per person. They do see a return, however. Just over $700 per person went to prize money in 2020.
More From GOBankingRates
Methodology: To determine which states loved playing the lottery the most, GOBankingRates looked at lottery ticket sales and prizes data from the United States Census Bureau. The study ranked the states from least to most spent per capita annually on lottery tickets. Per capita figures were calculated by dividing the total lottery ticket sales and total lottery prizes -- per the Census Bureau -- by the respective state's population. Alabama, Alaska, Hawaii, Nevada and Utah do not have a lottery system and therefore were excluded from the study. All data was collected and is up to date as of June 27, 2022.
This article originally appeared on GOBankingRates.com: These 22 States Love Playing the Lottery the Most
