What the 2020 Election Could Do to Your Stock Portfolio


Investing is filled with uncertainty during the best of times, so trying to figure out what — if anything — you should do to prepare your portfolio for another election is tough. On the one hand, the idea that a president really has that much control over the state of the economy while in office is a popular legend. But on the other hand, that doesn’t mean that markets, which frequently move out of step with the broader economy, won’t react to the election of a particular person or party.
So, is it better for the stock market if a Democrat or a Republican is elected? Or is party affiliation a red herring while it’s the re-election of an incumbent that actually might juice the market? Or could it be that a landslide win is what predicts market success, regardless of which party achieves it?
To get a better sense of whether there are any important patterns of note in how a presidential election may — or may not — impact your portfolio, GOBankingRates has broken down the performance of some notable stock indices in the aftermath of each election, showing performance from Election Day to the end of the new president’s first year in office and from the same point to the end of their final full year in office. Note, the numbers for President Donald Trump reflect the end of his third full year in office.
How might the 2020 election affect your portfolio? Here’s a look at what it might have meant in past cycles.
Last updated: Aug. 18, 2020
Different Stock Indices Can Represent Different Types of Companies
You can get a better sense of how a particular presidential election impacts different types of companies by looking at the various indices that can be used to track different sectors of the stock market.
The S&P 500, for instance, is known as the gold standard for large companies that make up the foundation of the American economy. The Russell 2000, however, is focused on “small-cap” companies — smaller businesses that are faster growing and earlier in their life cycle but less stable. (Note that it has existed only since 1987.) The Nasdaq, meanwhile, features many tech firms and pharmaceutical companies.
If you’re trying to spot a pattern in how stock markets react to presidential elections, looking at the performance of these indices in past elections helps.
1980
Candidates:
Democrat: Jimmy Carter (Incumbent)
Republican: Ronald Reagan
Results:
Carter: 49 electoral votes, 41.01% of the popular vote
Reagan: 489 electoral votes, 50.75% of the popular vote
America was struggling through trying times ahead of the 1980 election, hammered by the energy crisis, stagflation and the hostage situation in Iran. Ronald Reagan swept in with a conservative message that resonated deeply with many Americans, ultimately running away with the election for a huge electoral win and nearly a double-digit margin in the percentage of the popular vote over incumbent Jimmy Carter.
S&P 500
At the end of the first year in office: -5.03%
At the end of the fourth year in office: 29.60%
Nasdaq
At the end of the first year in office: 1.39%
At the end of the fourth year in office: 27.93%
1984
Candidates:
Democrat: Walter Mondale
Republican: Ronald Reagan (Incumbent)
Results:
Mondale: 13 electoral votes, 40.56% of the popular vote
Reagan: 525 electoral votes, 58.77% of the popular vote
While Walter Mondale would do only slightly worse than Jimmy Carter in terms of the portion of the popular vote, President Reagan dominated the Electoral College map. His second term notably included the 1987 market crash that had the largest single-day drop in the history of the S&P 500.
S&P 500
At the end of the first year in office: 23.98%
At the end of the fourth year in office: 62.97%
Nasdaq
At the end of the first year in office: 29.70%
At the end of the fourth year in office: 52.26%
1988
Candidates:
Democrat: Michael Dukakis
Republican: George H. W. Bush
Results:
Dukakis: 111 electoral votes, 45.65% of the popular vote
Bush: 426 electoral votes, 53.37% of the popular vote
George H.W. Bush served as vice president during the Reagan administration, so while he officially was not an incumbent, the argument could be made that he effectively ran as one. Massachusetts Gov. Michael Dukakis improved on the Democrats’ percentage of the votes but fell well short of victory.
S&P 500
At the end of the first year in office: 28.44%
At the end of the fourth year in office: 58.35%
Russell 2000
At the end of the first year in office: 15.86%
At the end of the fourth year in office: 52.14%
Up Next: See How Much Money Warren Buffett, Dana White and 35 Other CEOs Are Pouring Into the Election
Nasdaq
At the end of the first year in office: 20.06%
At the end of the fourth year in office: 78.71%
1992
Candidates:
Democrat: Bill Clinton
Republican: George H.W. Bush (Incumbent)
Results:
Clinton: 370 electoral votes, 43.01% of the popular vote
Bush: 168 electoral votes, 37.45% of the popular vote
Third-party candidate H. Ross Perot garnered nearly 19% of the popular vote, so while Arkansas Gov. Bill Clinton received only 43.01% of the vote, that was more than enough for the win. George H.W. Bush had sky-high approval ratings in the immediate aftermath of the first Gulf War, but the recession of the early 1990s left an opening for Clinton.
S&P 500
At the end of the first year in office: 11.08%
At the end of the fourth year in office: 76.40%
Russell 2000
At the end of the first year in office: 29.53%
At the end of the fourth year in office: 81.64%
Nasdaq
At the end of the first year in office: 28.49%
At the end of the fourth year in office: 113.54%
1996
Candidates:
Democrat: Bill Clinton (Incumbent)
Republican: Bob Dole
Results:
Clinton: 379 electoral votes, 49.23% of the popular vote
Dole: 159 electoral votes, 40.72% of the popular vote
In the immediate aftermath of the 1994 congressional midterm elections, when the Republicans gained the majority in the House of Representatives with their “Contract with America,” President Clinton’s re-election prospects seemed dim. However, a stalemate between the Republicans and Clinton forced a pair of government shutdowns, and that backfired on Speaker of the House Newt Gingrich and Senate Majority Leader Bob Dole — his congressional ally. Support turned toward Clinton, and he rode the rising new digital economy of the 1990s to the big win.
S&P 500
At the end of the first year in office: 35.89%
At the end of the fourth year in office: 84.88%
Russell 2000
At the end of the first year in office: 28.59%
At the end of the fourth year in office: 42.27%
Nasdaq
At the end of the first year in office: 27.77%
At the end of the fourth year in office: 101.01%
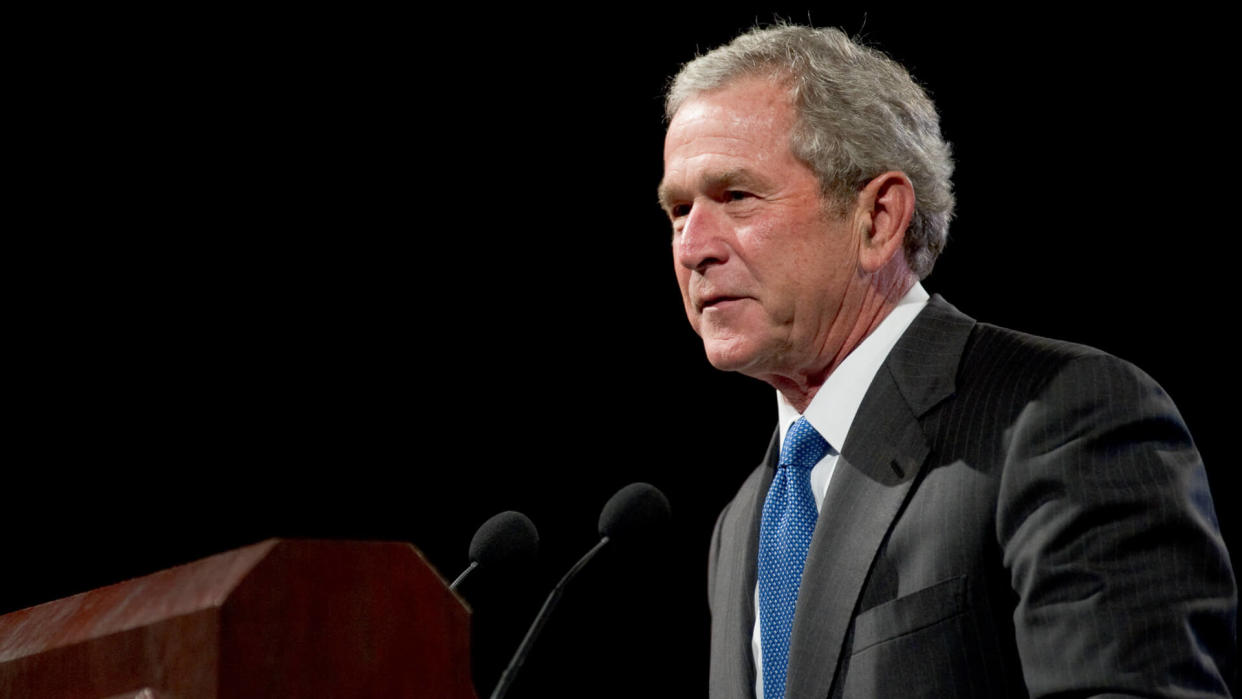
2000
Candidates:
Democrat: Al Gore
Republican: George W. Bush
Results:
Gore: 266 electoral votes, 48.38% of the popular vote
Bush: 271 electoral votes, 47.87% of the popular vote
While Al Gore served as vice president for eight years under Bill Clinton, personal scandals in the president’s second term forced Gore to deal with what pundits labeled “Clinton fatigue.” George W. Bush, meanwhile, campaigned on his brand of “compassionate conservatism.” The end result was one of the closest elections in U.S. history, with the Supreme Court having to settle the ultimate victor and a margin in the popular vote so small as to be statistically insignificant.
S&P 500
At the end of the first year in office: -19.82%
At the end of the fourth year in office: -15.36%
Russell 2000
At the end of the first year in office: -3.46%
At the end of the fourth year in office: 28.77%
Nasdaq
At the end of the first year in office: -42.90%
At the end of the fourth year in office: -36.31%
2004
Candidates:
Democrat: John Kerry
Republican: George W. Bush (Incumbent)
Results:
Kerry: 251 electoral votes, 48.26% of the popular vote
Bush: 286 electoral votes, 50.73% of the popular vote
The war in Iraq was a major issue throughout the 2004 contest, with America ultimately deciding not to remove an incumbent president with combat troops in the field. Massachusetts Sen. John Kerry also struggled to shake an image as an out-of-touch elitist.
S&P 500
At the end of the first year in office: 10.41%
At the end of the fourth year in office: -20.11%
Russell 2000
At the end of the first year in office: 14.99%
At the end of the fourth year in office: -14.69%
Nasdaq
At the end of the first year in office: 11.11%
At the end of the fourth year in office: -20.54%
Check Out: Will Kamala Harris Rake In Big Money for Biden?
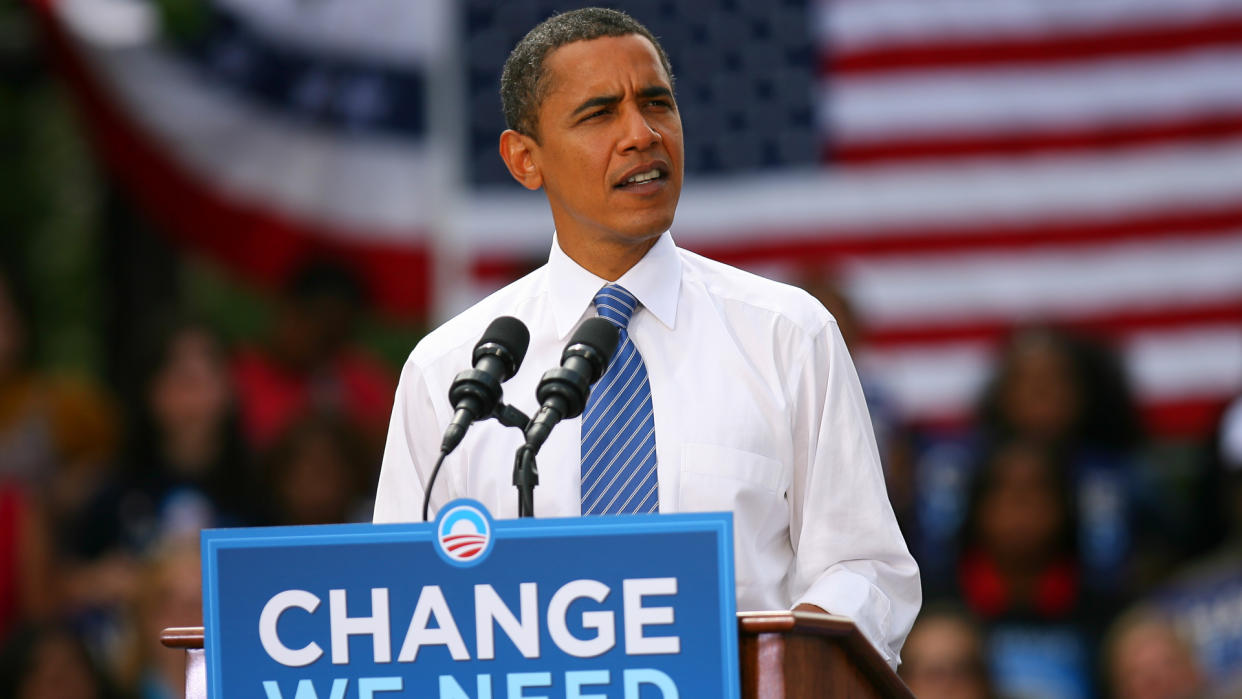
2008
Candidates:
Democrat: Barack Obama
Republican: John McCain
Results:
Obama: 365 electoral votes, 52.86% of the popular vote
McCain: 173 electoral votes, 45.60% of the popular vote
War hero John McCain finally got his shot at the White House in 2008, but it was not to be. He faced a charismatic young senator from Illinois right at a time when America seemed ready to move on from the Bush era, leading to Barack Obama’s historic run to become the nation’s first Black president.
S&P 500
At the end of the first year in office: 10.87%
At the end of the fourth year in office: 41.80%
Russell 2000
At the end of the first year in office: 14.55%
At the end of the fourth year in office: 55.57%
Nasdaq
At the end of the first year in office: 27.47%
At the end of the fourth year in office: 69.62%
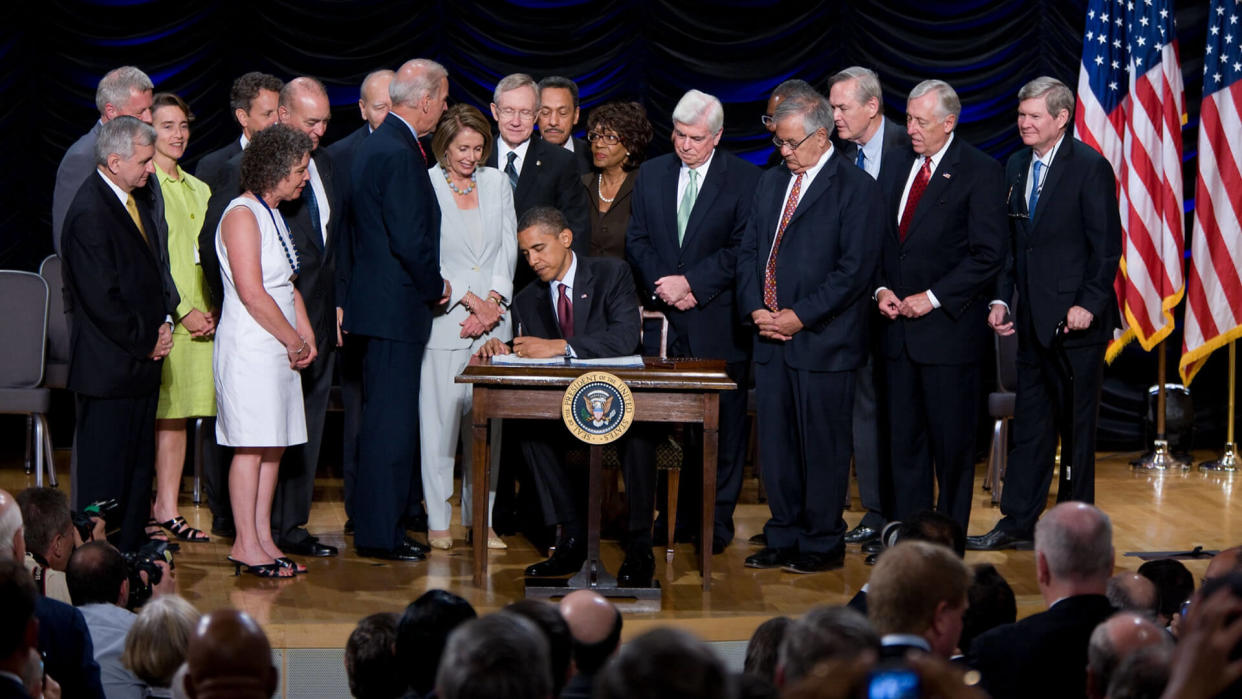
2012
Candidates:
Democrat: Barack Obama (Incumbent)
Republican: Mitt Romney
Results:
Obama: 332 electoral votes, 51.01% of the popular vote
Romney: 206 electoral votes, 47.15% of the popular vote
Former Massachusetts Gov. Mitt Romney emerged from the Republican primary to face incumbent Barack Obama, who many saw as vulnerable with the American economy still slogging through a slow recovery. Obama, though, proved to have impressed voters enough with his efforts and wound up with the win — though by a much smaller margin than four years earlier.
S&P 500
At the end of the first year in office: 29.40%
At the end of the fourth year in office: 56.74%
Russell 2000
At the end of the first year in office: 40.94%
At the end of the fourth year in office: 64.37%
Nasdaq
At the end of the first year in office: 38.67%
At the end of the fourth year in office: 78.73%
2016
Candidates:
Democrat: Hillary Clinton
Republican: Donald Trump
Results:
Clinton: 227 electoral votes, 48.02% of the popular vote
Trump: 304 electoral votes, 45.93% of the popular vote
Hillary Clinton — the former first lady, U.S. senator and Secretary of State — wound up winning the popular vote by a significant margin, but razor-thin triumphs in swing states including Wisconsin, Michigan and Pennsylvania provided businessman Donald Trump with an Electoral College win and put him in the White House.
S&P 500
At the end of the first year in office: 24.96%
At the end of the third year in office: 52.89%
Russell 2000
At the end of the first year in office: 28.48%
At the end of the third year in office: 23.87%
Nasdaq
At the end of the first year in office: 32.92%
At the end of the third year in office: 106.90%
2020
There is, of course, no way of knowing now how the election will impact markets in 2021 and beyond. For that matter, there’s no way of knowing that something won’t happen in the 2022 midterm elections that will define market movements far more than anything that happens this November. However, there are some notable trends.
If you’re thinking President Trump might be better for markets than his Democratic challenger, Joe Biden, there could be an argument for that based on his incumbent status. While not entirely consistent (see George W. Bush), two-term presidencies exhibit some correlation to stronger market performance in the second term — potentially showing the overall effect of the country having more confidence in its executive leadership. Then again, maybe it’s just that Democrats are what’s good for the stock markets given that Bill Clinton and Barack Obama have the strongest overall returns on the board.
But of course, the best explanation might be that any pattern is largely coincidence. If the dot-com crash of 2000 had come just a year or two earlier, Clinton’s sunny returns might look a lot more normal and George W. Bush’s ugly first term would show big growth. Likewise, if the housing crisis had come to a head in late 2009 rather than 2008, the younger Bush’s second-term results likely would look a lot better — and Obama’s a lot worse. So, in the end, it’s also possible that this is yet another example of how trying to time the market around any factor is usually going to provide inconsistent results at best.
More From GOBankingRates
This article originally appeared on GOBankingRates.com: What the 2020 Election Could Do to Your Stock Portfolio
