Will Michael Baker's Next Quarter Be a Bomb?

There's no foolproof way to know the future for Michael Baker (AMEX: BKR) or any other company. However, certain clues may help you see potential stumbles before they happen -- and before your stock craters as a result.
A cloudy crystal ball
In this series, we use accounts receivable and days sales outstanding to judge a company's current health and future prospects. It's an important step in separating the pretenders from the market's best stocks. Alone, AR -- the amount of money owed the company -- and DSO -- the number of days' worth of sales owed to the company -- don't tell you much. However, by considering the trends in AR and DSO, you can sometimes get a window onto the future.
Sometimes, problems with AR or DSO simply indicate a change in the business (like an acquisition), or lax collections. However, AR that grows more quickly than revenue, or ballooning DSO, can, at times, suggest a desperate company that's trying to boost sales by giving its customers overly generous payment terms. Alternately, it can indicate that the company sprinted to book a load of sales at the end of the quarter, like used-car dealers on the 29th of the month. (Sometimes, companies do both.)
Why might an upstanding firm like Michael Baker do this? For the same reason any other company might: to make the numbers. Investors don't like revenue shortfalls, and employees don't like reporting them to their superiors.
Is Michael Baker sending any potential warning signs? Take a look at the chart below, which plots revenue growth against AR growth, and DSO:
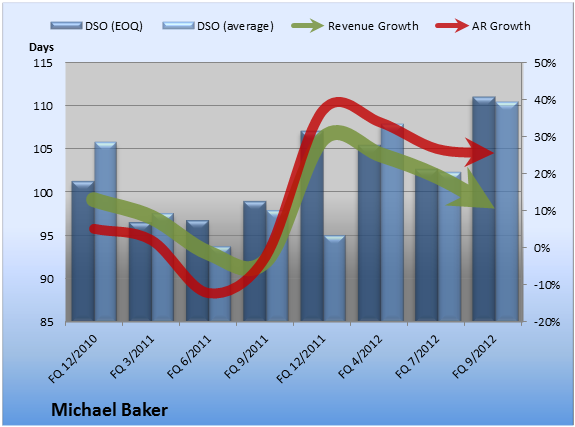
Source: S&P Capital IQ. Data is current as of last fully reported fiscal quarter. FQ = fiscal quarter.
The standard way to calculate DSO uses average accounts receivable. I prefer to look at end-of-quarter receivables, but I've plotted both above.
Watching the trends
When that red line (AR growth) crosses above the green line (revenue growth), I know I need to consult the filings. Similarly, a spike in the blue bars indicates a trend worth worrying about. Michael Baker's latest average DSO stands at 110.5 days, and the end-of-quarter figure is 111.1 days. Differences in business models can generate variations in DSO, and business needs can require occasional fluctuations, but all things being equal, I like to see this figure stay steady. So, let's get back to our original question: Based on DSO and sales, does Michael Baker look like it might miss its numbers in the next quarter or two?
The raw numbers suggest potential trouble ahead. For the last fully reported fiscal quarter, Michael Baker's year-over-year revenue grew 10.8%, and its AR grew 25.7%. That's a yellow flag. End-of-quarter DSO increased 12.2% over the prior-year quarter. It was up 8.1% versus the prior quarter. That demands a good explanation. Still, I'm no fortuneteller, and these are just numbers. Investors putting their money on the line always need to dig into the filings for the root causes and draw their own conclusions.
Can your portfolio provide you with enough income to last through retirement? You'll need more than Michael Baker. Learn how to maximize your investment income and "Secure Your Future With 9 Rock-Solid Dividend Stocks." Click here for instant access to this free report.
Add Michael Baker to My Watchlist.
The article Will Michael Baker's Next Quarter Be a Bomb? originally appeared on Fool.com.
Seth Jayson had no position in any company mentioned here at the time of publication. You can view his stock holdings here. He is co-advisor ofMotley Fool Hidden Gems, which provides new small-cap ideas every month, backed by a real-money portfolio. The Motley Fool has no positions in the stocks mentioned above. Try any of our Foolish newsletter services free for 30 days. We Fools may not all hold the same opinions, but we all believe that considering a diverse range of insights makes us better investors. The Motley Fool has a disclosure policy.
Copyright © 1995 - 2012 The Motley Fool, LLC. All rights reserved. The Motley Fool has a disclosure policy.
