The U.S. Natural Gas Story in 15 Charts

The story of U.S. natural gas gets referenced a lot but you may not know what's going on. Here are 15 charts that tell the story of the U.S. natural gas market.
Rise of horizontal drilling and hydraulic fracturing
In the past few years, new technologies and cheaper costs allowed producers to access gas trapped in parts of the U.S. previously considered unreachable. These include:
Drill bit steering has been enhanced.
Exponentially improved and perfected techniques for hydraulic fracturing. These were first pioneered by Mitchell Energy, now part of Devon Energy .
The development of horizontal drilling, which allowed for much cheaper costs. Whereas before you might need to drill 10 wells in an area, you could now drill just one.
With new techniques for fracturing, and much lower costs from horizontal drilling, companies were able to spend less and learn much more quickly than they would have otherwise. Horizontal drilling has now essentially taken over drilling in the U.S.
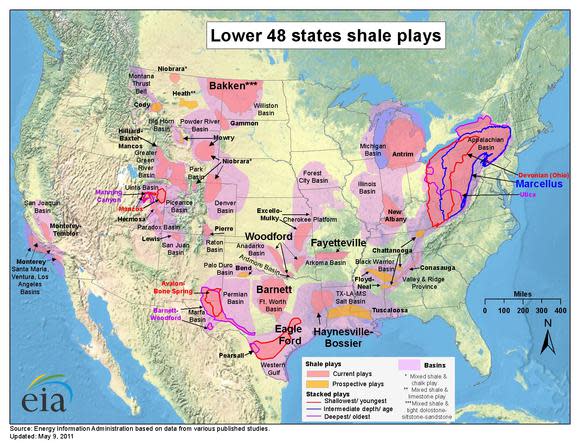
Drilling for natural gas took off in shale plays across the U.S.

Source: Baker Hughes North America Rotary Rig Count

Source: Baker Hughes North America Rotary Rig Count
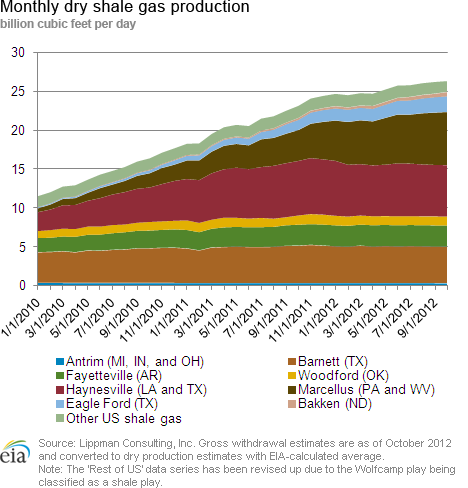
Source: EIA
Notice the Marcellus going from nothing to a major contributor in just two years.
Source: EIA
Production took off, weak demand dampened prices, storage filled up early
As more companies have tapped these unconventional plays, U.S. natural gas production has risen roughly 24% over the past five years, to 65.7 billion cubic feet per day, or Bcfd for short.

Source: Baker Hughes North America Rotary Rig Count
Rising production coupled with weak demand pushed down prices. There previously had been a rush to secure drilling leases in the U.S., but companies needed to drill otherwise they would be forced to give up the leases. Money from outside investors allowed the supply growth to continue in the face of challenging economics.
Things came to a head at the end of October 2011 when storage facilities basically reached capacity at 3,800 Bcf. With nowhere to store natural gas the price began to fall.

Source: EIA
As you can see above, supply going into storage in 2011 (the green line) was much higher than the averages over the previous five- and 10-year periods.
Retreat begins, rigs shift to search for oil and natural gas liquids
Natural gas companies saw the writing on the wall. Rigs drilling for natural gas peaked in the last two weeks of October 2011.
Efforts from the likes of Sandridge Energy and others had been steadily building to use techniques learned in natural gas to drill for oil and natural gas liquids. As natural gas was no longer profitable there was no stopping the trend of rigs drilling for oil. The only thing slowing it down was rigs specifically targeting plays with natural gas liquids. Chesapeake Energy and Kodiak Oil & Gasshifted their focus to liquids while others focused on oil.

Source: Baker Hughes North America Rotary Rig Count
Warm winter, low demand, natural gas price plummets
Mother Nature then decided not to cooperate with natural gas companies. Companies needed a cold winter but it was the warmest in years. Winter is important for the natural gas economy in order to use all the excess supply that was stored for the winter months. The demand wasn't there for the stored gas and with so much excess supply the price of natural gas collapsed to a low of just under $2 in April.

Source: EIA

Source: EIA
The cure for low natural gas prices is low natural gas prices
The laws of economics can work surprisingly well. Prices have slowly recovered to $3.6 per thousand cubic feet (mcf), but are still below many producers price of production. Low prices have led to an increase in demand from power companies, which took advantage this past summer of the cheap natural gas prices.

Source: EIA
On the supply side, low prices for natural gas have stalled production at just below 66 Bcfd. The retreat from natural gas drilling has been fast; in October 2011 there was a high of 936 rigs drilling for natural gas, today there are just over 400. Gas production would have fallen but the boost in oil drilling and production also generated a growth in associated gas that made up for the lost natural gas production. As such, natural gas production has been flat over the past 12 months, instead of declining.

Associated gas numbers aren't out yet for the year but this slide from Encana's projections for 2012 gets the point across. Associated gas production grew faster than Encana projected and is believed to have already hit 9 Bcfd.

Source: Encana
The future
So what does the future have in store for natural gas?
U.S. natural gas prices are remarkably low compared to the rest of the world.

You can read an explanation of why natural gas prices around the world are so different. This disparity won't last forever -- new demand is rising to take advantage of the low U.S. natural gas prices. American chemical companies and manufacturers are building new plants to take advantage of the comparatively low natural gas prices.
A second large source of natural gas demand growth will be exports. Currently there is one approved export terminal and 15 projects more are working their way through the approval process to export natural gas. If all 15 are approved and completed, then they will represent 23 Bcfd of new demand. While none will be finished till early 2015, they represent a huge longer-term source of demand.

The third and final source of growth is from power companies that are seeking to replace coal power plants with natural gas plants that are cheaper to manufacture and operate.

Foolish bottom line
While we can't be sure of what will happen to prices in the short term, in the medium term we expect the price of natural gas to rise.
Energy investors would be hard-pressed to find another natural gas company trading at a deeper discount than Chesapeake Energy. The company just put together a sale to improve its debt profile, allowing it to tackle its 2013 production schedule. While issues still persist, giant steps have been taken to help mitigate the problems seen throughout 2012. To learn more about Chesapeake and its enormous potential, you're invited to check out The Motley Fool's brand new premium report on the company. Simply click here now to access your copy. As an added bonus, you'll receive a full year of key updates and expert guidance as news continues to develop.
The article The U.S. Natural Gas Story in 15 Charts originally appeared on Fool.com.
Follow Dan on Twitter: @DanDzombak or by liking his Facebook page: DanDzombak. Dan owns shares of Chesapeake Energy. The Motley Fool owns shares of Devon Energy and has the following options: long JAN 2013 $16.00 calls on Chesapeake Energy, long JAN 2014 $20.00 calls on Chesapeake Energy, long JAN 2014 $30.00 calls on Chesapeake Energy, and short JAN 2014 $15.00 puts on Chesapeake Energy. Try any of our Foolish newsletter services free for 30 days. We Fools may not all hold the same opinions, but we all believe that considering a diverse range of insights makes us better investors. The Motley Fool has a disclosure policy.
Copyright © 1995 - 2012 The Motley Fool, LLC. All rights reserved. The Motley Fool has a disclosure policy.
