The Problems With the Unemployment Rate

Every first Friday of the month, the Bureau of Labor Statistics releases unemployment figures, and investors and algorithms keep their finger on the trading button to trade shares worth millions of dollars based on the report. But how accurate is the employment data? That depends.
A history of revisions
The BLS report on the first Friday, often cited for moving major indexes such as the Dow Jones Industrial Average and S&P 500 , is a preliminary unemployment number. As the BLS states, "not all sampled firms are able to report their data in time to be used in the first preliminary estimates," and a second estimate is released a month later, followed up by a final estimate two months after the first report. These revisions can drastically change the original estimate -- the one that can greatly affect how the market trades for the day. The BLS keeps a record of the revisions over the year after it finalizes the numbers with tax records:
Year | Revision Difference |
2006 | 752,000 |
2007 | (293,000) |
2008 | (89,000) |
2009 | (902,000) |
2010 | (378,000) |
2011 | 162,000 |
Source: Bureau of Labor Statistics.
Over the year, the difference between actual and estimates can amount to a huge variance, as in 2009, when total employment was overestimated by almost 1 million payrolls. This specific difference ends up changing the unemployment rate by about 0.7% -- not a huge difference, but still significant, especially if trading is based on these numbers. But, of course, chances are those who trade based on these numbers are short-term investors who exit the trades made before the numbers become revised.
The takeaway here: Unemployment figures can change, sometimes by a significant margin, from the first report. For example, October's report was revised from an addition of 171,000 to just 138,000 -- about a 20% difference between the first report and the first revision.
Changing populations
The unemployment rate is based on workers who do not have a job, who are currently available to work, and who have actively looked for work in the past four weeks. That means that those who aren't looking for work drop out of the equation and out of the labor force. But even though they are out of the labor force, they still count under the employment-population ratio:
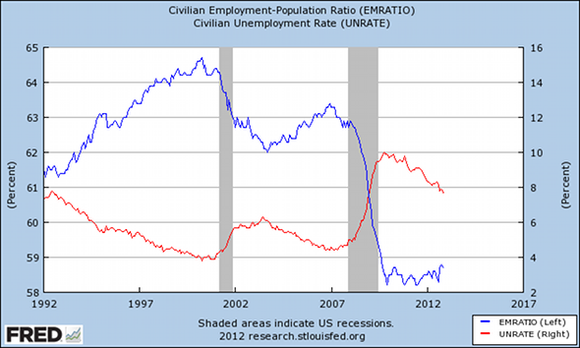
So even though unemployment has decreased from 10% to a little below 8% since the latest recession, the number of workers in comparison to the overall population hasn't changed much. Whereas before the recession more than 63% of the population worked, now a little less than 59% work.
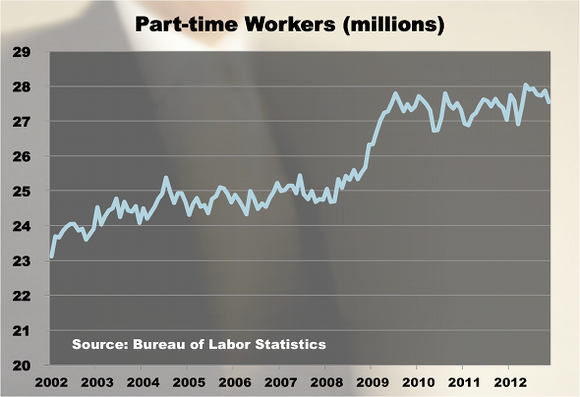
Additionally, the definition of "employed" includes part-time workers, whose earnings are likely significantly lower, and the self-employed -- even if those self-employed workers made no money from their own businesses. The BLS believes unpaid workers like this make up a relatively small portion. If they do exist, it would be a portion of the 9.7 million self-employed workers today, which is about the same number that existed in 2002. The number of part-time workers, however, has increased about 20% since 2002:
Counting part-time workers who want a full-time position and those "marginally attached" -- that is, those unemployed who are not looking for work but want a job and have looked for one in the past 12 months -- the unemployment rate is above 14%:
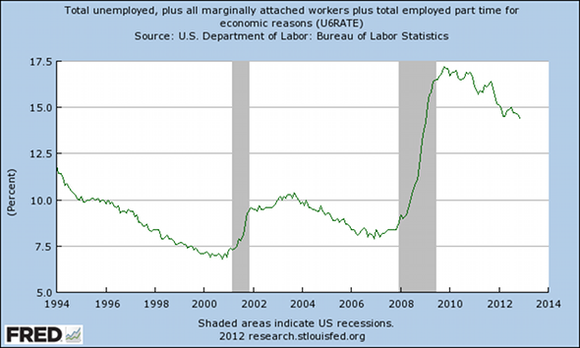
And some on the fringes of trust in government and society label the unemployment rate higher than 20%.
The takeaway from this: Depending on how the unemployment rate is measured, it can vary significantly, and not all of those who are defined as employed are full-time contributors and earners.
A rational view of the unemployment picture
While there are obvious issues with the unemployment rate, it is the best metric we have available to measure joblessness. As with any economic measure, there are caveats that should be kept in mind when reading the latest BLS report. And keep in mind what Fool Morgan Housel writes: "The best predictor of future market returns is not economic growth, interest rates, oil prices, or unemployment. It's valuations."
So while more jobs might lead to more iPhones sold, the fact that Apple now trades at 12 times earnings yet grew revenue 45% last year with a significant pile of cash matters much more to its future earnings. Or take Intel , which is trading at one of its lowest valuations since being a public company with a price-to-earnings ratio of less than nine.
For a more detailed overview of whether Apple remains a buy, check out our new premium report on the company. The Motley Fool's senior technology analyst and managing bureau chief, Eric Bleeker, is prepared to fill you in on both reasons both to buy and to sell Apple, as well as what opportunities are left going forward. To get instant access to his latest thoughts on Apple, simply click here now.
The article The Problems With the Unemployment Rate originally appeared on Fool.com.
Fool contributor Dan Newman owns shares of Intel. The Motley Fool owns shares of Apple and Intel. Motley Fool newsletter services recommend Apple and Intel. Try any of our Foolish newsletter services free for 30 days. We Fools may not all hold the same opinions, but we all believe that considering a diverse range of insights makes us better investors. The Motley Fool has a disclosure policy.
Copyright © 1995 - 2012 The Motley Fool, LLC. All rights reserved. The Motley Fool has a disclosure policy.
