Jobs: Same As It Ever Was

The monthly employment report is the single most-watched piece of economic data that exists. Every report is painstakingly predicted and analyzed in detail as soon as it is released.
Yet for how eagerly anticipated these reports are, there's been a frustrating trend for two years now: Very little has changed. Statistically, each of the past 23 employment reports has looked similar to all the others.
Any single employment report is highly suspect, given the shortcomings of sampling statistics. So it's helpful to look at averages. I prefer the rolling six-month average. It shows changes in employment stuck in a tight range for the past two years:
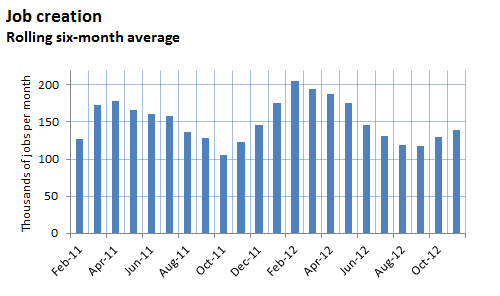
Sources: Bureau of Labor Statistics, author's calculations.
There have been ups and downs, most of which can be written off as seasonal noise and margins of error. But for the most part, employment has steadily grown by 150,000 a month since early 2011. Forget the breaking news, the deep analysis, the parsing, and the predictions. That's all you needed to know about jobs for the past two years.
And what will growth of 150,000 jobs a month get us?
The old rule of thumb is that the economy needs about 150,000 jobs just to keep up with population growth. But with an aging population and a growing percentage attending school, that figure is dropping, to perhaps 100,000 or less. So current jobs growth is enough to bring down the unemployment rate. Just very, very slowly.
Catherine Rampell of TheNew York Times explains just how slowly: "Getting the economy to 5 percent unemployment within two years -- a return to the rate that prevailed when the recession began -- would require job growth of closer to 270,000 a month." We are nowhere near that level of growth today. At current growth rates, it will be the early 2020s before a 5% unemployment rate is reclaimed. With figures like that, it may be worth redefining what "normal" is.
The blog Calculated Risk puts our employment recovery in proper perspective:

Beyond the noise of monthly jobs reports, here are a few trends and figures:
The unemployment rate for those age 25 and up without a high school diploma is 12.2%. For those with a bachelor's degree, it's 3.8%.
The unemployment rate for men is 7.9%. For married men, it's 4.7%.
Since 2010, government employment has declined by 1 million jobs. Private employment has increased by 4.5 million.
There were 3.6 million job openings in September, up from 2.7 million in 2010.
The labor force participation rate for those age 65 and up was 18.7% in November. That was near the highest level since 1964, and up from 13% a decade ago.
The Bureau of Labor Statistics calculates unemployment six different ways, the broadest of which measures those who have stopped looking for work or are working part-time involuntarily. Every measure of unemployment has declined in the past year.
What do you make of today's jobs market? Share your stories below.
To learn more about a few exchange-traded funds that have great promise for delivering profits to shareholders in the recovering global economy, check out The Motley Fool's special free report, "3 ETFs Set to Soar During the Recovery." Just click here to access it now.
The article Jobs: Same As It Ever Was originally appeared on Fool.com.
Try any of our Foolish newsletter services free for 30 days. We Fools don't all hold the same opinions, but we all believe that considering a diverse range of insights makes us better investors. The Motley Fool has a disclosure policy.
Copyright © 1995 - 2012 The Motley Fool, LLC. All rights reserved. The Motley Fool has a disclosure policy.
