The Fiscal Cliff in Pictures

You may be tired of all the "fiscal cliff" commentary, but that may be due to the walls of text that accompany every article. What's been missing? A fiscal-cliff picture book.
Here's a set of graphs and charts from the nonpartisan Congressional Budget Office showing what would happen given either no compromise or what it calls an "alternative fiscal scenario." In its alternative, all tax cuts except the payroll tax cut are extended, the alternative minimum tax is indexed for inflation, Medicare payment rates are not cut, and the automatic spending cuts don't happen.
The deficit

Source: CBO, "An Update to the Budget and Economic Outlook," August 2012.
The deficit would shrink to a measly 0.4% of GDP by 2018 given the fiscal cliff, whereas the alternative only cuts it to 4.2% of GDP. These deficits, of course, feed into total debt.
The debt
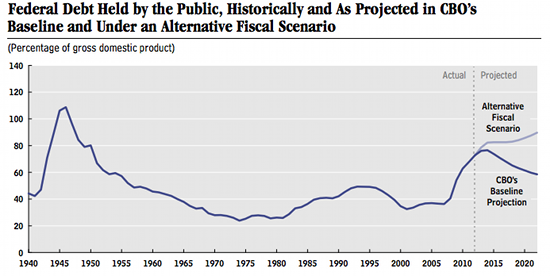
Source: CBO, "An Update to the Budget and Economic Outlook," August 2012.
The alternative scenario leads us to nearly 90% debt to GDP, whereas the cliff takes us less than 60% debt to GDP. What are the specific contributors to this debt and deficits?
The deficits broken down

Source: CBO, "An Update to the Budget and Economic Outlook," August 2012.
The tax policies have the greatest effect on deficits going forward, with spending cuts accounting for a much smaller portion. The scary part here, as any credit card holder might know, is the growing debt service. That's the interest the government has to pay on its debt. What do we get for these higher deficits?
Unemployment

Source: CBO, "An Update to the Budget and Economic Outlook," August 2012.
For one, unemployment would likely remain around 8% in 2013, versus the fiscal cliff scenario, where it is forecast to rise to more than 9%. In the long run, though, unemployment in 2022 is forecast to be a little higher than 5% for both scenarios.
GDP growth
Source: CBO, "An Update to the Budget and Economic Outlook," August 2012.
Going off the cliff will earn us a bruise on our GDP, shrinking it about 0.5% in 2013. The alternative, meanwhile, allows us to grow more than 1.5%. In 2022, however, the increased debt burden for the alternative takes a small chomp out of future GDP.
Don't be a lemming
As these pictures illustrate, we can survive no matter what policies are enacted. While individual companies that rely heavily on the government might be stung -- e.g., Lockheed Martin (NYS: LMT) , which takes in 82% of revenue from government business, or General Dynamics (NYS: GD) , which counts on the government for 69% of revenue -- it also shows that cuts to program budgets will only be a small part of an overall solution.
And even with the S&P 500 (INDEX: ^GSPC) falling more than 5% since the election, there are plenty of reasons for long-term optimism beyond the next year. Recent corporate investments -- such as GE's (NYS: GE) $200 million in financing for two liquid-natural-gas plants that GE, along with partner Clean Energy Fuels (NAS: CLNE) , will bring online in 2015 -- might be a sign that the large cash piles corporations have been sitting on through the recession will finally be put toward infrastructure and future business investments.
If the pictures above have sparked your interest in further researching the impacts of the fiscal cliff or alternative scenarios on one of America's largest companies, take a look at our premium report on GE. This report spells out not only GE's opportunities, such as liquid natural gas, but also the risks it faces, like its reliance on currently weak Europe for 20% of its revenue. For your copy of this premium report, along with updates on relevant news and analysis, click here.
The article The Fiscal Cliff in Pictures originally appeared on Fool.com.
Fool contributor Dan Newman has no positions in the stocks mentioned above. The Motley Fool owns shares of Clean Energy Fuels, General Dynamics, General Electric Company, and Lockheed Martin. Motley Fool newsletter services recommend Clean Energy Fuels. Try any of our Foolish newsletter services free for 30 days. We Fools may not all hold the same opinions, but we all believe that considering a diverse range of insights makes us better investors. The Motley Fool has a disclosure policy.
Copyright © 1995 - 2012 The Motley Fool, LLC. All rights reserved. The Motley Fool has a disclosure policy.
