Why the Market Is Now Expensive

Take a look at the following unlabeled chart and try to guess what it represents:
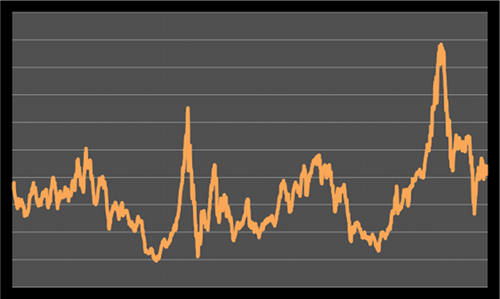
You might think it's the S&P 500 (INDEX: ^GSPC) over the past year, or maybe some more arcane economic metric like corporate profits per capita as a proportion of GDP that requires someone versed in tea leaves to read.
It's actually a metric that you should be familiar with, if you aren't already.
It's the Shiller P/E ratio, also called the P/E10 or the cyclically adjusted price-to-earnings (CAPE) ratio. This special ratio averages the past 10 years of earnings in order to cancel out the effect of economic cycles on valuations. Currently, it's at 21.5. Historically, since 1881, the average is about 16.5.
What does this mean? Even though the traditional P/E ratio puts the market in fairly valued territory (currently 15.9, near the historical mean of 15.5), the Shiller P/E tells us that right now the market is expensive.
And the Shiller P/E has been fairly accurate in the past.
The best and worst decades
A research paper from Cambria Investment Management highlights the best and worst 10-year periods to have invested since 1871, along with the Shiller P/E at the start of those decades. The summary:
Decades | Average Real Return | Average Shiller P/E Ratio |
Best | 16.1% | 10.92 |
Worst | (3.3%) | 23.31 |
With the Shiller P/E at 21.5, it's now much closer to the worst decades to invest than the best.
Expected returns
The Cambria report also notes the expected 10-year returns at different starting Shiller P/Es. For Shiller P/Es between 20 and 25, where the market is currently priced, the annual rate of return over the next decade is expected to be just 2.7%. While higher than a 10-year treasury bond's current yield of 1.7%, it's a far cry from what investors typically expect.
This is especially true for retirees whose pensions or other retirement accounts might assume a certain rate of return. With the potential returns over the next 10 years looking rather slim, those expecting to draw upon their savings and live off of investments might have to augment their income in other ways.
A global example
In June, Fool Alex Dumortier wrote about the cheapest market he had in the world: Hong Kong's Hang Seng Index. He calculated a Shiller P/E of 14, versus its average since 1996 of 18.6. He ended up recommending iShares MSCI Hong Kong ETF (ASE: EWH) as an easy way to get exposure to the cheap index. Since his recommendation, the ETF is up 16.6%, compared to the S&P 500's gain of 7% and the Dow Jones Industrial's (INDEX: ^DJI) gain of 4.2%.
Of course, this outperformance occurred despite widespread fear that China's growth was gearing down. This is also what the Cambria report showed: The scariest times to invest in certain countries saw the best returns.
Looking at instances in countries where the Shiller P/E sank below five, the markets returned 35% over the next year. This includes the U.S. in 1920, the U.K. in 1974, South Korea in 1997, Ireland in 2008, and the most relevant example today: Greece in 2011.
And looking at the opposite occasions, when Shiller P/Es rose past 50, the following year delivered a loss of 15%. The closest the U.S. has come to this number was at the end of 1999, when the Shiller P/E was 44. The S&P 500 fell 7% over the following year.
What to do
Even while the overall market may be expensive, single companies can always present a good value. For example, the market discounted Starbucks (NAS: SBUX) before its most recent earnings report. Over the summer, the market worried about domestic same-store sales growth falling from 8% the prior year to 7%, as well as store closings in Europe. These worries discounted the stock, even though Europe contributed a fraction of operating profit and margins rose despite slowing same-store growth. After the latest earnings report wiped away these fears, the stock jumped nearly 10%.
Meanwhile, fear of mobile processing has punished a rule maker like Intel (NAS: INTC) , which now trades at a P/E last seen in the mid-1990s, despite its market share dominance and technological superiority over the competition.
The usual caveats to using the Shiller P/E apply: Just because a higher Shiller P/E has formerly meant lower returns, that doesn't mean the market will ever follow that pattern again. But given that the market may be expensive, it's all the more important to single out companies that have been unfairly beaten down.
One such stock is currently reeling from the fall in natural-gas prices. But once prices eventually recover, it will reward those who grabbed shares early. You can uncover it today, totally free, in our premium research report: "The One Energy Stock You Must Own Before 2014."
The article Why the Market Is Now Expensive originally appeared on Fool.com.
Fool contributor Dan Newman owns shares of Starbucks and Intel. The Motley Fool owns shares of Intel and Starbucks and has the following options: short JAN 2013 $47.00 puts on Starbucks. Motley Fool newsletter services recommend Intel and Starbucks. Try any of our Foolish newsletter services free for 30 days. We Fools may not all hold the same opinions, but we all believe that considering a diverse range of insights makes us better investors. The Motley Fool has a disclosure policy.
Copyright © 1995 - 2012 The Motley Fool, LLC. All rights reserved. The Motley Fool has a disclosure policy.
