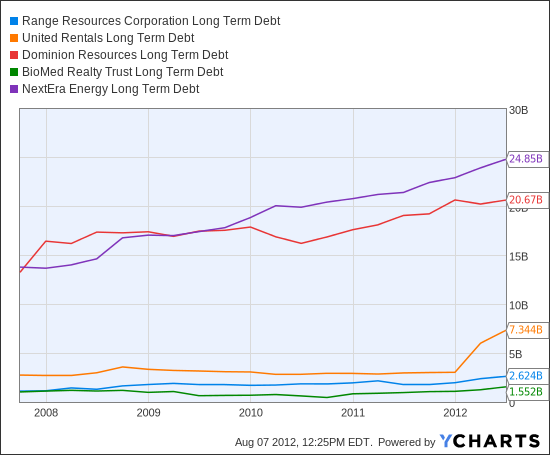
The 5 Stocks With the Worst Free Cash Flow and Debt-to-Cash Ratios


After having fun finding out which companies had the most cash on hand in Follow the Money: 5 Extremely Cash-Rich Stocks, I thought it would also be fun to invert the process and find out which names are deeply, deeply in debt with little cash on hand to do anything about it.
Please note that this is not a conventional debt/equity analysis. I was more interested in debt in relation to cash on hand and cash flow -- or in other words, how the companies are handling things now, and how strong (or shaky) the financials would appear in a day-to-day sense if they suddenly had to start paying debt.
To create my list, I looked at all companies with a negative free cash flow worse than -$200 million. Next I looked at what cash those companies had on hand (including short-term investments).
I threw out any company that had more cash on hand than its negative cash flow and were leveraged in the ballpark of 1:12 or better (cash to long-term debt). To my thinking, these companies seemed like they had things under control.
This screening yielded 23 companies that I ranked in terms of cash on hand vis-a-vis long-term debt. Interestingly, the two companies with the largest negative cash flow -- Chesapeake Energy (CHK) at -$3.256 billion and Bunge (BG) at -$2.646 billion -- were not dramatically overleveraged in comparison to their peers. I calculated Chesapeake Energy's leverage at 1:25 and Bunge's at 1:14.75.
One quick side note: As with any financial data, the numbers I used (from Ycharts) capture a moment in time. They are a snapshot, if you will, versus a professional portrait, and may not have captured the companies in their best light. I have made no attempt to smooth the numbers, such as using twelve months trailing data. Similarly, I made zero attempt to quantify long-term investments, goodwill, or value assets.
The top five money pits by my criteria are listed below in order of how leveraged they appeared to be from the data I saw. Stock prices are as of about 12:45 p.m. EDT, Tuesday.
%Gallery-162009%
Bristol Voss holds no positions in stocks mentioned.
