How High Can Philip Morris Fly?

Shares of Philip Morris International (NYS: PM) hit a 52-week high yesterday. Let's take a look at how the company got there to find out whether clear skies remain on the horizon.
How it got here
Philip Morris, like its former corporate parent Altria (NYS: MO) , has offered defensive dividend-hungry investors shelter from the international macroeconomic storm. Altria recently hit its own all-time high, and most major tobacco companies are pushing their own stock-price ceilings upward as well:
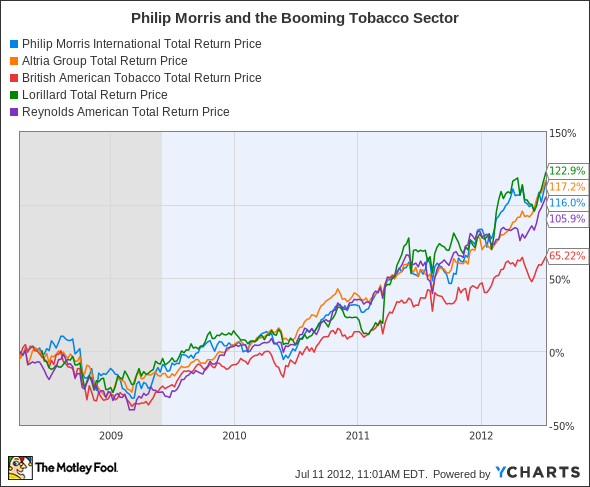
PM Total Return Price data by YCharts
Philip Morris isn't (as of this writing) the best performer in the sector, but it's a pretty close race. It doesn't hurt that Philip Morris has beaten analyst expectations in both earnings reports released this year, either.
What you need to know
Strong buying interest across the sector has driven many tobacco companies to high valuations as well as high stock prices. Let's take a quick look at the sector's key metrics before diving in to Philip Morris' particulars:
Company | P/E Ratio | Free Cash Flow (TTM) | Net Margin (TTM) | Dividend Yield |
|---|---|---|---|---|
Philip Morris | 17.9 | $9.07 billion | 27.8% | 3.4% |
Altria | 21.2 | $3.28 billion | 20.6% | 4.6% |
British American Tobacco (NYS: BTI) | 21.7 | $3.95 billion | 20.1% | 5.4% |
Lorillard (NYS: LO) | 16.9 | $1.05 billion | 16.9% | 4.6% |
Reynolds American (NYS: RAI) | 20.7 | $1.37 billion | 15.3% | 5.2% |
Source: Yahoo! Finance, Morningstar.
Philip Morris is one of the cheaper stocks in this basket, and despite its superior net margin, also offers one of the lowest dividend yields. On the other hand, that means it offers one of the most sustainable payout ratios:
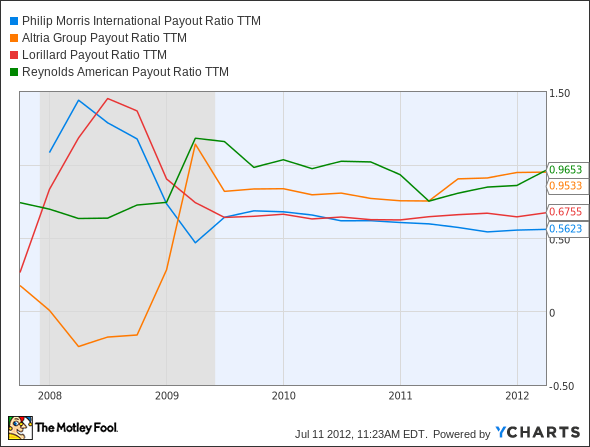
PM Payout Ratio TTM data by YCharts
British American, which doesn't show up on this chart, has a payout ratio of 76% for the trailing 12 months. It's also important to look at how much the valuations have grown over time. Since its spinoff, Altria's P/E has grown far more than Philip Morris':
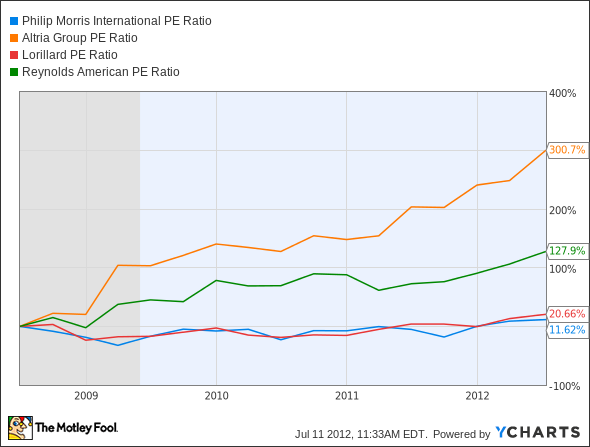
PM P/E Ratio data by YCharts
The picture these charts paint is one where Philip Morris has far more room to run in the future than any of its peers. That's the conclusion I and my fellow contributors Travis Hoium and Sean Williams arrived at when debating Altria's merits.
It doesn't help American tobacco companies to have an increasingly belligerentgovernment arrayed against it, leading to job cuts at Reynolds and Altria this year. International brands have their fair share of problems, but there are many places in the world with relatively lax regulations.
What's next?
Where does Philip Morris go from here? Without the heavy hand of U.S. juries and agencies, the company should avoid any major damages that threaten to undermine its domestic peers. The biggest risk on the horizon is a European meltdown -- Philip Morris makes the lion's share of its sales in Europe, and wild currency fluctuations resulting from a euro breakup would wreak havoc on the company's bottom line. If Philip Morris can push through that wall of worry, it's likely to have a relatively smooth ride ahead.
The Motley Fool's CAPS community has given Philip Morris a perfect five-star rating, with a remarkable 98% of our CAPS players expecting the stock to continue its 52-week trend.
Interested in tracking this stock as it continues on its path? Add Philip Morris to your watchlist now for all the news we Fools can find, delivered to your inbox as it happens. If you're looking for more big, safe, growing dividends, take a look at our latest free report. It's got all the best information on "The Three Dow Stocks Dividend Investors Need."
At the time thisarticle was published Fool contributor Alex Planes holds no financial position in any company mentioned here. Add him on Google+ or follow him on Twitter @TMFBiggles for more news and insights.The Motley Fool has a disclosure policy. We Fools may not all hold the same opinions, but we all believe that considering a diverse range of insights makes us better investors. Try any of our Foolish newsletter services free for 30 days.
Copyright © 1995 - 2012 The Motley Fool, LLC. All rights reserved. The Motley Fool has a disclosure policy.
