The Cheapest Market in the World

In May, as the sheen wore off the European Central Bank's EUR 1 trillion liquidity extravaganza and fresh concerns about Chinese and U.S. growth surfaced, the wheels came off the global rally in risk assets. That reversal has created real opportunity for value-conscious investors who prefer to pay less, not more, for assets. But while strategists and other seers are constantly going on about how cheap U.S. equities are -- which is a matter of legitimate debate -- I have heard very little said about the Hong Kong stock market, which is remarkably, demonstrably cheap.
The number no one is looking at
On what basis do I make this claim? You're right to ask. I've looked at the price-to-earnings (P/E) multiple of the Hang Seng Index, Hong Kong's benchmark index, but not any P/E multiple, mind you.
I constructed a historical series of the P/E10, which uses average trailing-10-year earnings, adjusted for inflation. This is the same methodology that professor Robert Shiller of Yale has championed for the S&P 500 (the P/E10 is sometimes referred to as the Shiller P/E.) Normalizing earnings this way smoothes out some of the noise linked to the business cycle and produces a P/E multiple that has proved to be a good predictor of long-term U.S. equity returns.
A crisis-worthy valuation
Based on Tuesday's closing price, the Hang Seng's P/E10 is 14.0, compared to an average value of 18.6 going back to December 1996. For reference, the index sported a higher valuation than that on nearly 40% of the trading days during the period spanning the fourth quarter of 2008 through the first quarter of 2009 -- the worst of the storm. Imagine being able to go back and buy U.S. stocks at the prevailing valuations during the same period!
In fact, the Hang Seng's P/E10 hit a credit crisis low of 11.1 on March 9, 2009 (if this date rings a bell, it's the same date on which the S&P 500 recorded its lowest closing value). In other words, at the very depths of the credit crisis, the Hang Seng Index was only about 20% cheaper than it is today.
Looking forward... with hindsight
Below is a table that I call the hindsight returns matrix, which shows the distribution of 10-year inflation-adjusted total returns (annualized), conditional on the starting values of the P/E10, which have been split into five ranges (1st quintile: P/E10 values greater than 20.9, 2nd quintile: P/E10 values between 17.2 and 20.9, and so on.) Below the table, I explain how to interpret the results.
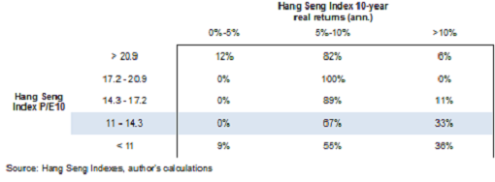
I've highlighted the table's fourth row, which corresponds to a P/E10 range of 11.0 to 14.3, since the current multiple is in that range. In the past, that valuation range has been associated with annualized real returns of 5% to 10% two-thirds of the time and returns greater than 10% one-third of the time! Those certainly sound like attractive numbers, particularly in the current environment. I would nonetheless caution readers that the P/E10 and returns series only goes back as far as December 1996 -- much shorter than I would like for this type of analysis.
Two dollars, one peg
Another attractive aspect of the Hong Kong stock market for U.S. investors is minimal currency risk; indeed, the Hong Kong dollar has been pegged to the U.S. dollar for three decades. Investors shouldn't treat a currency peg as a physical constant. Only yesterday, in fact, a former head of the Hong Kong Monetary Authority suggested Hong Kong's central bank should review the policy and consider pegging the currency to China's yuan instead. Still, I think this is no more than a medium-term risk until China makes significantly more progress toward the international acceptance of the yuan.
The best way to get onboard
U.S. investors have a good vehicle with which to get exposure to the Hong Kong market in the iShares MSCI Hong Kong ETF (NYS: EWH) . As an asset allocation-focused investor, I'm more comfortable talking about markets than individual stocks. However, when an index is cheap, it follows that at least some of the stocks that make up that index are cheap also. For stock pickers, I think the area of greatest opportunity is probably financials and real estate.
Cheap, cheap, cheap
Here are five names that I think look attractive, on a first pass, based on a low P/E10 and significant discrepancy between their P/E10 and the price-to-earnings ratio based on the next 12 months' earnings estimate (i.e. they may appear relatively expensive on the basis of estimated earnings, but look relatively cheap on the basis of their earnings power): Cathay Pacific Airways (HKSE: 0293.HK), Cheung Kong Holdings (HKSE: 0001.HK), Henderson Land Development (HKSE: 0012.HK), Sun Hung Kai Properties, and Hutchison Whampoa (HKSE: 0013.HK). Alternatively, you can add international exposure to your portfolio with the three American companies set to dominate the world.
At the time thisarticle was published Fool contributorAlex Dumortierholds no position in any company mentioned.Click hereto see his holdings and a short bio; you can follow him onLinkedIn. The Motley Fool has adisclosure policy. We Fools may not all hold the same opinions, but we all believe thatconsidering a diverse range of insightsmakes us better investors. Try any of our Foolish newsletter servicesfree for 30 days.
Copyright © 1995 - 2012 The Motley Fool, LLC. All rights reserved. The Motley Fool has a disclosure policy.
