What's Driving Ford?
Legendary fund manager Peter Lynch once said that you shouldn't invest in any idea you couldn't illustrate with a crayon.
Though I'm not much for crayons, I do love the pithiness of that line. We regularly preach the same idea at the Fool: Don't buy what you don't understand. And if you can't simply sketch out a company's business model -- how it actually makes money -- then maybe you shouldn't be investing in it.
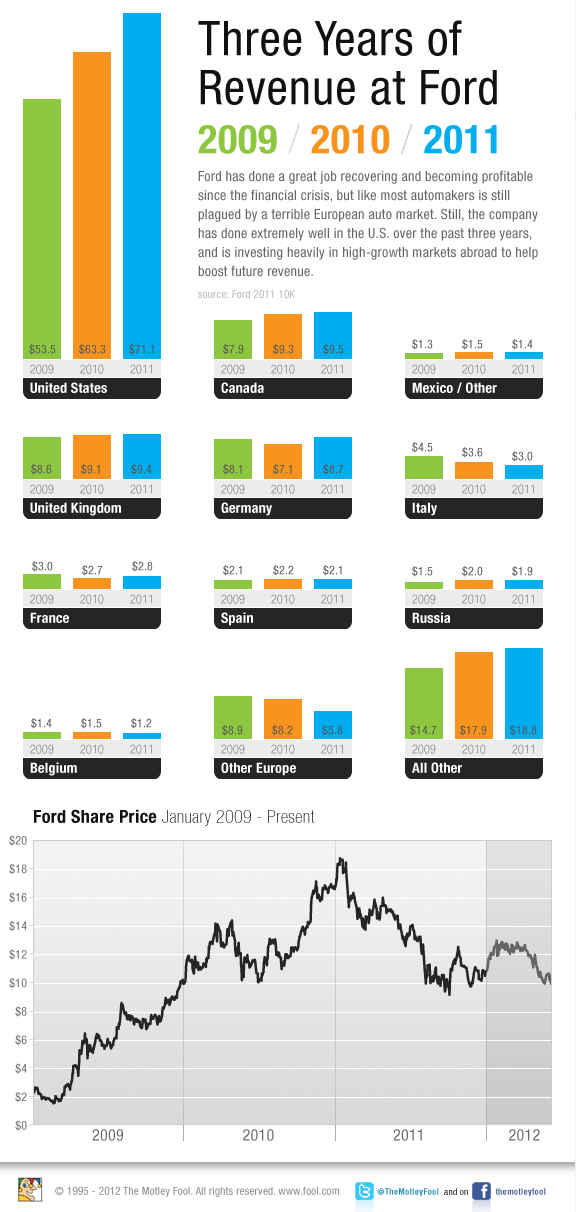
As a Ford (NYS: F) shareholder, I can attest to the fact that it's been a tough year. I've seen more and more Fords on the road, but the share price hasn't reflected that observation the way I would have hoped. Let's take a graphical look at Ford's revenue performance over the past three years and see whether we can figure out why the stock price might be lagging in the face of strong revenue growth domestically. (Note: I'm focusing on revenues here, not earnings.)

Source: Ford 2011 10-K.
Think I missed something in this illustration? General thoughts on this exercise? Let me know in the comments section below. And if you haven't already, be sure to follow our Ford news and commentary using the Fool's free new My Watchlist tool.
At the time thisarticle was published Fool.com graphics/photo/art editor Dari FitzGerald owns shares of Ford. Try any of our Foolish newsletter services free for 30 days. We Fools don't all hold the same opinions, but we all believe that considering a diverse range of insightsmakes us better investors. The Motley Fool has a disclosure policy.
Copyright © 1995 - 2012 The Motley Fool, LLC. All rights reserved. The Motley Fool has a disclosure policy.

