Will Deere's Earnings Predict Economic Recovery?

When looking at earnings quality, we at The Motley Fool have two databases -- EQ Scan and EQ Score -- that help us uncover cash flow and revenue recognition issues. Smart financial officers can use several techniques to manipulate financial results, and manipulation of any of the three financial statements usually affects the other two. But a critical eye on these statements can often uncover trends that could be important to help investors protect against losing their hard-earned money.
The EQ Score database assigns an index rank to the company, from 1, for the lowest quality, to 5, for the highest. As the company's financial status changes over time, the database adjusts its rank and illuminates trends that will affect earnings quality going forward. Let's look today at Deere (NYS: DE) , which reports earnings tomorrow, and see why the EQ Score ranks DE as a "1" -- equivalent to an "F" letter grade.
Deere has been around since 1837, and Most Fools will recognize the Illinois-based company as a venerable manufacturer of equipment serving agriculture, construction, and forestry. Analysts expect Deere to report $9.70 billion in revenue and $2.53 in earnings per share, which will be almost 23% better than last year's reported EPS of $2.06 for the same quarter. If the company meets its revenue target, it will be a 16% increase from last year's $8.33 billion.
Deere competes with several foreign and domestic heavyweights. Some of its overseas competitors include AB Volvo, Honda, Bombardier, and Bosch. Let's see how a couple of its U.S. competitors are performing: Caterpillar (NYS: CAT) and Briggs & Stratton (NYS: BGG) .
Company | Reporting Date | Revenue | EPS | EQ Score |
|---|---|---|---|---|
Caterpillar | July 25 | $17.28 billion | $2.32 | 3 |
Briggs & Stratton | Aug. 6 | $606.10 million | $0.27 | 2 |
Source: Motley Fool; S&P Capital IQ.
Caterpillar scores a "3," and Briggs & Stratton ranks as a "2."
Now let's look at Deere's income-statement metrics.
Metric | Quarter Ended 1/31/2012 | Quarter Ended 1/31/2011 | Quarter Ended 1/31/2010 |
|---|---|---|---|
Revenue (billions) | $6.77 | $6.12 | $4.83 |
Revenue +/- % | 10.6% | 26.7% | NA |
Cost of Goods Sold | 68% | 67% | 66% |
Gross Margin (R-COGS) | 30% | 30% | 29% |
Selling, General, and Administrative Costs (SG&A) | 10% | 11% | 13% |
Operating Margin | 12% | 12% | 8% |
Net Profit Margin | 8% | 8% | 5% |
Earnings Before Interest, Taxes, Depreciation, and Amortization (EBITDA) | 15% | 16% | 13% |
Earnings Per Share (EPS) | $1.30 | $1.20 | $0.57 |
Source: S&P Capital IQ.
As expected, Deere's income-statement metrics read like the large industrial manufacturer it is. Since the "Great Recession," revenue has increased year over year, but the rate of increase is slowing; the cost of sales is high because of the inventory needed to make its products, and selling and administrative costs are low and decreasing. Operating and profit margins are good but not great, and earnings per share are moving in the right direction.
Now let's look at the metrics that affect cash flows.

DE Cash Conversion Cycle data by YCharts
Receivables, inventories, and the cash conversion cycle are all rising. Days sales outstanding is high at 62.7 days. Inventory levels have more than doubled during over the past two years from $2.8 billion to $5.67 billion, whereas receivables have increased by about $1 billion. Deere's cash conversion cycle has increased by almost 75 days in two years. Moreover, days in inventory has been rising, from 78 days in 2010 to 113 days in 2012. Deere is using payables as short-term financing -- days payable outstanding is at 132 days, and payables as a percentage of revenue is a distressing 98%.
The takeaway is that Deere's customers are themselves still recovering from the recession. Sales are sluggish, the sales cycle is taking longer to complete, and cash is hard to collect. Increasing inventories suggest that customers are buying only what they absolutely need to run their businesses. Deere has been forced to stretch out payables to its suppliers as a result. Because Deere has ample working capital of over $18 billion, the added long-term debt in all likelihood has been used to reduce shares outstanding.
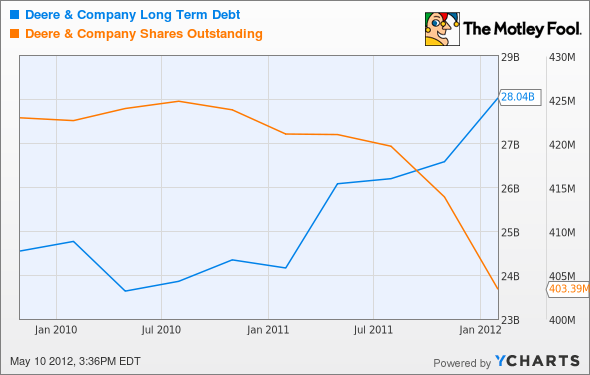
DE Long Term Debt data by YCharts
Competitor No. 1 -- Caterpillar
Caterpillar's income-statement metrics look good and show a more pronounced positive retracement from recessionary lows. Its inventories are rising, and at a faster pace than receivables. Days in inventory, however, are higher than for Deere, at 134 days. But because days sales outstanding and the cash conversion cycle are both declining, there is less concern over cash flow.
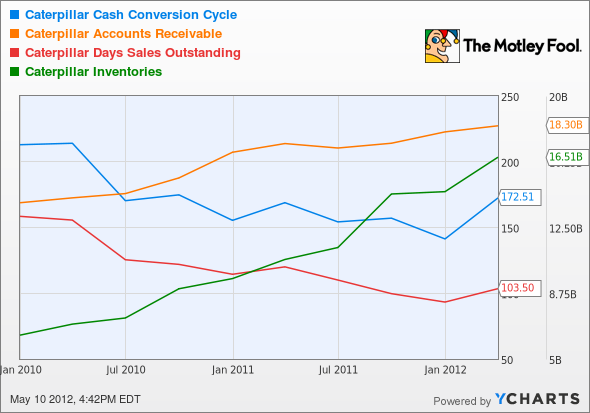
CAT Cash Conversion Cycle data by YCharts
Competitor No. 2 -- Briggs & Stratton

BGG Cash Conversion Cycle data by YCharts
The chart reflects B&S's shorter sales cycle. Fluctuations in the days sales outstanding and receivables cause the fluctuations in the cash conversion cycle and operating cash. Inventories are well managed.
In the hierarchy of metrics affecting earnings quality, revenue is most important, and cash flow is more important than net income. In other words, Wall Street tends to focus on the wrong metric as the basis for its recommendations to buy, hold, or sell a stock. Since last October, Deere's stock price has fluctuated between $61.72 and $79.00 currently, or 28%. Its trailing P/E is 11.7. Last year's earnings came in at $6.63 per share, and analysts expect earnings of $8.02 a share this year, a 21% increase.
These equipment titans can serve as leading indicators of economic recovery, but currently it appears that recovery is slow. While we wait, shareholders will receive an annual dividend of $1.84, a yield of 2.3%. Prudent Fools should make investment decisions based on consideration of earnings quality.
One of the great things about companies like Deere is the great dividends they pay, but there are even better ones out there. You can read about them in our special free report: Secure Your Future With 9 Rock-Solid Dividend Stocks. See which dividends made the grade.
At the time thisarticle was published John Del Vecchiois the co-advisor of Motley Fool Alpha and co-manager of the Active Bear ETF. You may follow him on Twitter, where he goes by @johnfdelvecchio. He owns no shares in the companies mentioned in this article. We Fools don't all hold the same opinions, but we all believe thatconsidering a diverse range of insightsmakes us better investors. Try any of our Foolish newsletter servicesfree for 30 days. The Motley Fool has adisclosure policy.
Copyright © 1995 - 2012 The Motley Fool, LLC. All rights reserved. The Motley Fool has a disclosure policy.
