Total Increases Sales but Misses Revenue Estimate

Total (NYS: TOT) reported earnings on April 27. Here are the numbers you need to know.
The 10-second takeaway
For the quarter ended March 31 (Q1), Total missed slightly on revenues and whiffed on earnings per share.
Compared to the prior-year quarter, revenue improved and GAAP earnings per share contracted.
Margins shrank across the board.
Revenue details
Total recorded revenue of $62.35 billion. The two analysts polled by S&P Capital IQ wanted to see a top line of $63.48 billion on the same basis. GAAP reported sales were 5.7% higher than the prior-year quarter's $59.00 billion.
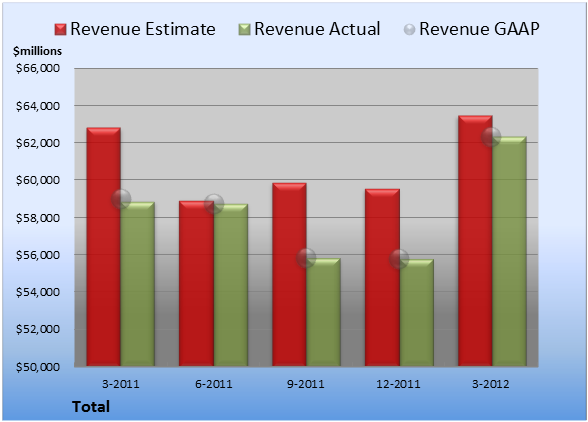
Source: S&P Capital IQ. Quarterly periods. Dollar amounts in millions. Non-GAAP figures may vary to maintain comparability with estimates.
EPS details
EPS came in at $1.78. The two earnings estimates compiled by S&P Capital IQ averaged $2.17 per share. GAAP EPS of $2.16 for Q1 were 13% lower than the prior-year quarter's $2.48 per share.

Source: S&P Capital IQ. Quarterly periods. Non-GAAP figures may vary to maintain comparability with estimates.
Margin details
For the quarter, gross margin was 31.5%, 300 basis points worse than the prior-year quarter. Operating margin was 16.3%, 220 basis points worse than the prior-year quarter. Net margin was 7.8%, 170 basis points worse than the prior-year quarter.
Looking ahead
Next quarter's average estimate for revenue is $60.87 billion. On the bottom line, the average EPS estimate is $1.83.
Next year's average estimate for revenue is $245.55 billion. The average EPS estimate is $7.64.
Investor sentiment
The stock has a five-star rating (out of five) at Motley Fool CAPS, with 1,356 members out of 1,379 rating the stock outperform, and 23 members rating it underperform. Among 344 CAPS All-Star picks (recommendations by the highest-ranked CAPS members), 339 give Total a green thumbs-up, and five give it a red thumbs-down.
Of Wall Street recommendations tracked by S&P Capital IQ, the average opinion on Total is outperform, with an average price target of $65.31.
How did Total treat you during the oil spike in 2008 and the subsequent bust? More importantly, what are you doing to prepare for the next spike that some experts believe another spike may be just around the corner? Prepare yourself with a well-positioned energy stock we profile in "The Only Energy Stock You'll Ever Need." Click here for instant access to this free report.
Add Total to My Watchlist.
At the time thisarticle was published Seth Jayson had no position in any company mentioned here at the time of publication. You can view his stock holdings here. He is co-advisor ofMotley Fool Hidden Gems, which provides new small-cap ideas every month, backed by a real-money portfolio. Motley Fool newsletter services have recommended buying shares of Total. Try any of our Foolish newsletter services free for 30 days. We Fools may not all hold the same opinions, but we all believe that considering a diverse range of insights makes us better investors. The Motley Fool has a disclosure policy.
Copyright © 1995 - 2012 The Motley Fool, LLC. All rights reserved. The Motley Fool has a disclosure policy.
