Reynolds American Misses on the Top and Bottom Lines

Reynolds American (NYS: RAI) reported earnings on April 24. Here are the numbers you need to know.
The 10-second takeaway
For the quarter ended March 31 (Q1), Reynolds American missed slightly on revenues and missed estimates on earnings per share.
Compared to the prior-year quarter, revenue contracted slightly and GAAP earnings per share dropped significantly.
Gross margins improved, operating margins expanded, and net margins shrank.
Revenue details
Reynolds American booked revenue of $1.93 billion. The seven analysts polled by S&P Capital IQ expected to see revenue of $1.97 billion on the same basis. GAAP reported sales were 2.9% lower than the prior-year quarter's $1.99 billion.
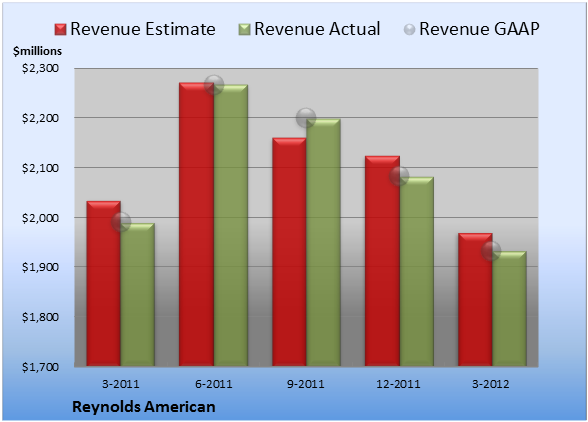
Source: S&P Capital IQ. Quarterly periods. Dollar amounts in millions. Non-GAAP figures may vary to maintain comparability with estimates.
EPS details
Non-GAAP EPS came in at $0.63. The 13 earnings estimates compiled by S&P Capital IQ anticipated $0.65 per share on the same basis. GAAP EPS of $0.47 for Q1 were 22% lower than the prior-year quarter's $0.60 per share.
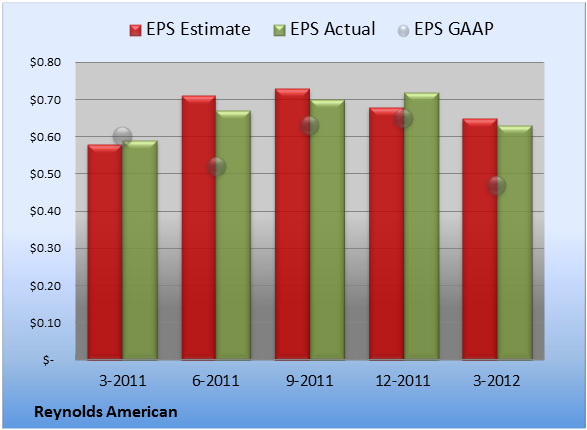
Source: S&P Capital IQ. Quarterly periods. Non-GAAP figures may vary to maintain comparability with estimates.
Margin details
For the quarter, gross margin was 48.6%, 190 basis points better than the prior-year quarter. Operating margin was 32.9%, 180 basis points better than the prior-year quarter. Net margin was 14.0%, 370 basis points worse than the prior-year quarter.
Looking ahead
Next quarter's average estimate for revenue is $2.25 billion. On the bottom line, the average EPS estimate is $0.77.
Next year's average estimate for revenue is $8.56 billion. The average EPS estimate is $2.94.
Investor sentiment
The stock has a four-star rating (out of five) at Motley Fool CAPS, with 596 members out of 643 rating the stock outperform, and 47 members rating it underperform. Among 205 CAPS All-Star picks (recommendations by the highest-ranked CAPS members), 195 give Reynolds American a green thumbs-up, and 10 give it a red thumbs-down.
Of Wall Street recommendations tracked by S&P Capital IQ, the average opinion on Reynolds American is hold, with an average price target of $41.55.
Can your portfolio provide you with enough income to last through retirement? You'll need more than Reynolds American. Learn how to maximize your investment income and "Secure Your Future With 9 Rock-Solid Dividend Stocks." Click here for instant access to this free report.
Add Reynolds American to My Watchlist.
At the time thisarticle was published Seth Jayson had no position in any company mentioned here at the time of publication. You can view his stock holdings here. He is co-advisor ofMotley Fool Hidden Gems, which provides new small-cap ideas every month, backed by a real-money portfolio. Try any of our Foolish newsletter services free for 30 days. We Fools may not all hold the same opinions, but we all believe that considering a diverse range of insights makes us better investors. The Motley Fool has a disclosure policy.
Copyright © 1995 - 2012 The Motley Fool, LLC. All rights reserved. The Motley Fool has a disclosure policy.
