Is Men's Wearhouse's Stock a Bargain by the Numbers?

Numbers can lie -- but they're the best first step in determining whether a stock is a buy. In this series, we use some carefully chosen metrics to size up a stock's true value based on the following clues:
The current price multiples
The consistency of past earnings and cash flow
How much growth we can expect
Let's see what those numbers can tell us about how expensive or cheap Men's Wearhouse (NYS: MW) might be.
The current price multiples
First, we'll look at most investors' favorite metric: the P/E ratio. It divides the company's share price by its earnings per share -- the lower, the better.
Then, we'll take things up a notch with a more advanced metric: enterprise value to unlevered free cash flow. This divides the company's enterprise value (basically, its market cap plus its debt, minus its cash) by its unlevered free cash flow (its free cash flow, adding back the interest payments on its debt). Like the P/E, the lower this number is, the better.
Analysts argue about which is more important -- earnings or cash flow. Who cares? A good buy ideally has low multiples on both.
Men's Wearhouse has a P/E ratio of 16.1 and an EV/FCF ratio of 23.3 over the trailing 12 months. If we stretch and compare current valuations to the five-year averages for earnings and free cash flow, Men's Wearhouse has a P/E ratio of 17.8 and a five-year EV/FCF ratio of 16.1.
A positive one-year ratio under 10 for both metrics is ideal (at least in my opinion). For a five-year metric, under 20 is ideal.
Men's Wearhouse has a mixed performance in hitting the ideal targets, but let's see how it compares against some competitors and industry-mates.
Men's Wearhouse | 16.1 | 23.3 | 17.8 | 16.1 |
Jos. A. Bank Clothiers (NAS: JOSB) | 14.2 | 18.4 | 19.5 | 21.8 |
Casual Male Retail Group | 10.9 | 11.3 | NM | 13.4 |
Macy's | 12.1 | 13.1 | NM | 12.5 |
Source: S&P Capital IQ. NM = not meaningful due to losses.
Numerically, we've seen how Men's Wearhouse's valuation rates on both an absolute and relative basis. Next, let's examine...
The consistency of past earnings and cash flow
An ideal company will be consistently strong in its earnings and cash flow generation.
In the past five years, Men's Wearhouse's net income margin has ranged from 3.1% to 8.6%. In that same time frame, unlevered free cash flow margin has ranged from 2.4% to 7.3%.
How do those figures compare with those of the company's peers? See for yourself:
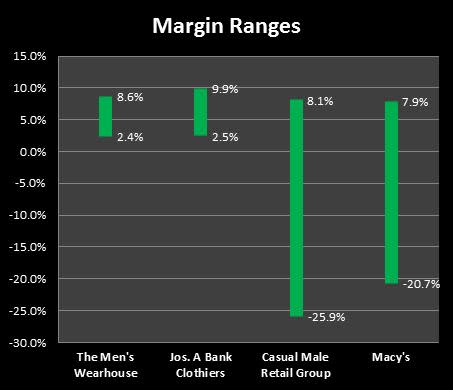
Source: S&P Capital IQ; margin ranges are combined.
Additionally, over the last five years, Men's Wearhouse has tallied up five years of positive earnings and five years of positive free cash flow.
Next, let's figure out...
How much growth we can expect
Analysts tend to comically overstate their five-year growth estimates. If you accept them at face value, you willoverpay for stocks. But while you should definitely take the analysts' prognostications with a grain of salt, they can still provide a useful starting point when compared to similar numbers from a company's closest rivals.
Let's start by seeing what this company's done over the past five years. In that time period, Men's Wearhouse has put up past EPS growth rates of -2.5%. Meanwhile, Wall Street's analysts expect future growth rates of 13.2%.
Here's how Men's Wearhouse compares to its peers for trailing five-year growth:
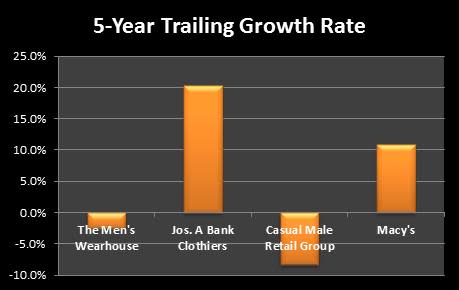
Source: S&P Capital IQ; EPS growth shown.
And here's how it measures up with regard to the growth analysts expect over the next five years:
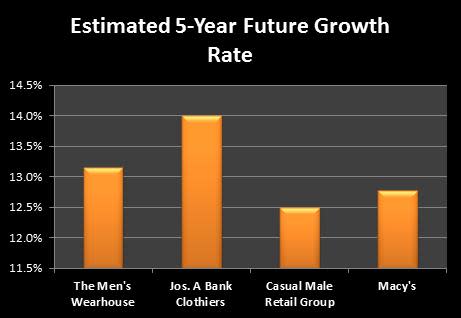
Source: S&P Capital IQ; estimates for EPS growth.
The bottom line
The pile of numbers we've plowed through has shown us the price multiples shares of Men's Wearhouse are trading at, the volatility of its operational performance, and what kind of growth profile it has -- both on an absolute and a relative basis.
The more consistent a company's performance has been and the more growth we can expect, the more we should be willing to pay. We've gone well beyond looking at a 16.1 P/E ratio and we see pretty reasonable numbers all around for Men's Wearhouse in terms of price multiples and margins. However, we see negative growth versus five years ago. Jos. A. Bank, with similar multiples and margins, managed to grow.
Our CAPS community rates Men's Wearhouse two stars out of five, but all this is just a start. If you find Men's Wearhouse's numbers or story compelling, don't stop. Continue your due diligence process until you're confident one way or the other. As a start, add it to My Watchlist to find all of our Foolish analysis.
I wrote about a stock that's flying under the radar in our brand-new free report: "The Stocks Only the Smartest Investors Are Buying." I invite you to take a free copy to find out the name of the company I believe Warren Buffett would be interested in if he could still invest in small companies.
At the time thisarticle was published Anand Chokkaveluholds no position in any company mentioned. Try any of our Foolish newsletter servicesfree for 30 days. We Fools may not all hold the same opinions, but we all believe thatconsidering a diverse range of insightsmakes us better investors. The Motley Fool has adisclosure policy.
Copyright © 1995 - 2012 The Motley Fool, LLC. All rights reserved. The Motley Fool has a disclosure policy.
