Foot Locker's Dividend X-ray

Not all dividends are created equal. Here, we'll do a top-to-bottom analysis of a given company to understand the quality of its dividend and how that's changed over the past five years.
The company we're looking at today is Foot Locker (NYS: FL) , which yields 2.8%.
Industry
Foot Locker is a footwear retailer that, like competitor Collective Brands (NYS: PSS) , struggled through the recession. Collective Brands' Payless Shoe Source and Foot Locker both struggled as consumers were cash-strapped and not spending money. Foot Locker's stock has been doing well recently, though, after the company instituted a share buyback program.

Foot Locker Total Return Price Chart by YCharts
Dividend
To evaluate the quality of a dividend, the first thing to consider is whether the company has paid a dividend consistently over the past five years, and if so, how much it has grown.

Foot Locker Dividend Chart by YCharts
Foot Locker has been steadily raising its quarterly dividend the past five years.
Immediate Safety
To understand how safe a dividend is, we use three crucial tools:
The interest coverage ratio, or the number of times interest is earned, calculated by earnings before interest and taxes, divided by interest expense. The interest coverage ratio measures a company's ability to pay the interest on its debt. An interest coverage ratio less than 1.5 is questionable; a number less than one means that the company is not bringing in enough money to cover its interest expenses.

Foot Locker Times Interest Earned TTM Chart by YCharts
Foot Locker covers every $1 in interest expense with nearly $70 in operating earnings.
Sustainability
The other tools we use to evaluate a dividend's safety are:
The EPS payout ratio, or dividends per share divided by earnings per share. The EPS payout ratio measures the percentage of earnings that go toward paying the dividend. A ratio greater than 80% is worrisome.
The FCF payout ratio, or dividends per share divided by free cash flow per share. Earnings alone don't always paint a complete picture of a business's health. The FCF payout ratio measures the percent of free cash flow devoted toward paying the dividend. Again, a ratio greater than 80% could be a red flag.

Source: S&P Capital IQ.
While Foot Locker's earnings payout ratio has been all over the place, the firm's free cash flow payout ratio has stayed steady near 40%.
Alternatives
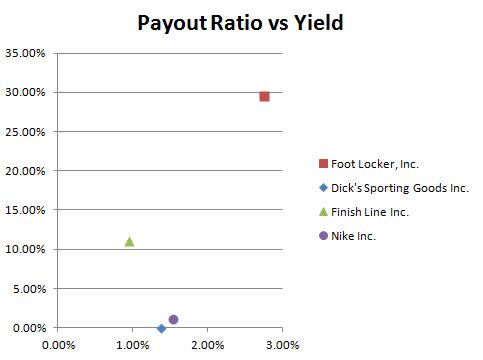
Source: S&P Capital IQ.
There are some alternatives out there in the industry. Nike (NYS: NKE) and Dick's Sporting Goods (NYS: DKS) both sport yields near 1.5% and low payout ratios. Finish Line (NAS: FINL) is the odd man out with a yield of 1% and a payout ratio of 11%.
Another tool for better investing
Most investors don't keep tabs on their companies. That's a mistake. If you take the time to read past the headlines and crack a filing now and then, you're in a much better position to spot potential trouble early. We can help you keep tabs on your companies with My Watchlist, our free, personalized stock-tracking service.
Add Foot Locker to My Watchlist.
At the time thisarticle was published FollowDan Dzombakon Twitter at@DanDzombakto check out his musings and see what articles he finds interesting.Motley Fool newsletter serviceshave recommended buying shares of Nike.Motley Fool newsletter serviceshave recommended creating a diagonal call position in Nike. Try any of our Foolish newsletter servicesfree for 30 days. We Fools may not all hold the same opinions, but we all believe thatconsidering a diverse range of insightsmakes us better investors. The Motley Fool has adisclosure policy.
Copyright © 1995 - 2011 The Motley Fool, LLC. All rights reserved. The Motley Fool has a disclosure policy.
