Look Out Below: Short-Sellers and Reality Intrude on Priciest Stocks

If we Americans can't count on tasty single-serving coffee and super-cheap rental movies -- and also on getting stupid-rich betting on the companies that sell these items -- what's the world coming to?
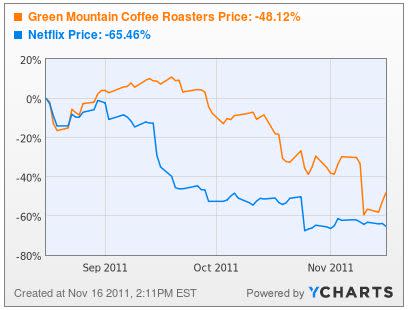
Green Mountain Coffee Roasters Stock Chart by YCharts
As one sees above in the 90-day price chart of Netflix (NAS: NFLX) and Green Mountain Coffee Roasters (NAS: GMCR) , sometimes highflyers come crashing down, and that's a bummer. These are probably both good-quality companies. Netflix has a strong position in the growing digital movie distribution business. Green Mountain is leading the at-home/at-office gourmet coffee movement. But when stocks get bid up to ridiculous multiples, it doesn't take much to send them plunging. And Netflix and Green Mountain both had achieved nutty PEs.
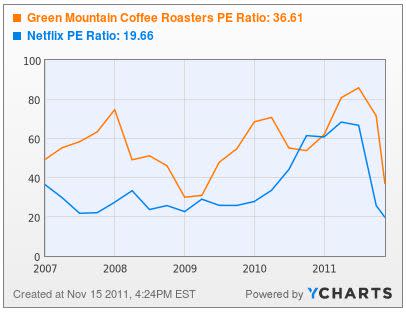
Green Mountain Coffee Roasters P/E Ratio Chart by YCharts
So, who's next? That, of course, could depend on which highflyer David Einhorn sinks his teeth into now that his bearish case has helped to bring Green Mountain down to earth. Or which company's management takes its cue from Netflix and unveils a radically new strategy certain to piss off its customers. And there are certainly other ways to let the air out of a gassy stock. A simple earnings miss. Aggressive accounting methods that become too obvious to ignore. So, it's worth looking at some still-levitating stocks. If they're in your portfolio, you might want to double-check the fundamentals, given the increasingly unforgiving nature of today's market.
Using the YCharts stock screener, we searched for companies with market caps of $2 billion or more and with PEs of over 50. We got 88 hits! Some have towering PEs because the E, for earnings, is presently low but likely headed up, and the market has priced, as in P, that cyclical move into the shares. We focused instead on four companies that are highly visible to consumers, given that direct and positive contact with a company -- think Apple (NAS: AAPL) -- often causes retail investors to want to buy the stock. We're not suggesting these are crummy companies. Only that their lofty valuations make them vulnerable to the slightest hiccup.
LinkedIn (NYS: LNKD) is growing like a weed, with revenue up about 120% for the first nine months of 2011, to $354.4 million. To get that growth, however, the company is investing lots of money -- $111.5 million on sales and marketing during those three quarters, and $90.2 million on product development. So, profit for the nine months was slightly less than $5 million, or a nickel a share, giving the roughly $75 stock, at this writing, a P/E of over 1,500. Yikes.
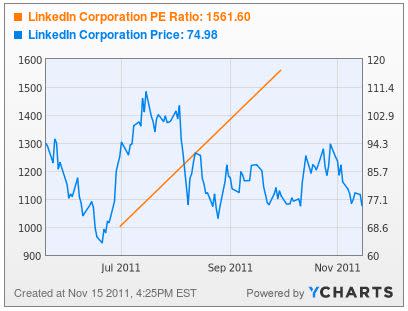
LinkedIn Corporation P/E Ratio Chart by YCharts
Fresh Market (NAS: TFM) , a sort of poor-man's Whole Foods (NAS: WFM) , isn't quite growing like a weed, but it is growing nicely on the basis of new store openings and an expected 4%-to-5% growth in sales at existing stores this year. Sales for the 26 weeks ended July 31 rose about 12%. Profit, however, fell 23% as a higher tax rate kicked in this year. Margins in the grocery business, are teensy, so with $0.50 a share in profit for the first six months of the fiscal year, the current stock price puts the P/E well above 100. The air is thin up there.
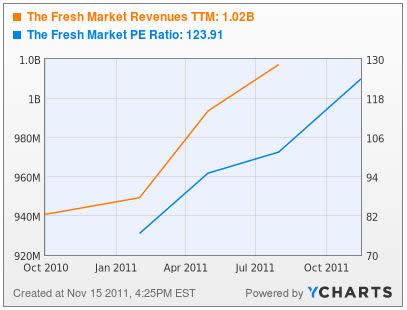
The Fresh Market Revenues TTM Chart by YCharts
lululemon athletica (NAS: LULU) is growing more rapidly than Fresh Market, with sales in the 26 weeks ended July 31 up 37% to $399.1 million. And the margins are lusher when you're selling pricy yoga wear to affluent ladies. Profit for the six months was $71.8 million, or 49 cents a diluted share. That gives lululemon a comparatively scrawny P/E of slightly more than 50. And revenue has accelerated in recent quarters. Still, there may be a limited number of women who can spend $98 on a pair of tights.
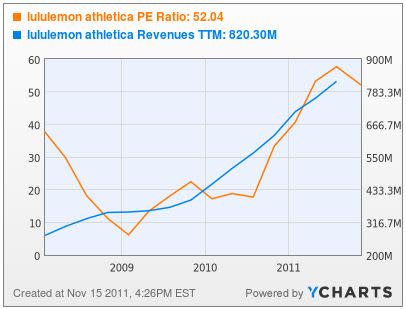
lululemon athletica P/E Ratio Chart by YCharts
Chipotle Mexican Grill (NYS: CMG) has achieved a market cap of more than $10 billion as investors have rewarded it with a price-to-sale ratio approaching 5. Comparable-store sales in the nine months ended September 30 rose 11.2%. That, and an aggressive store expansion program, are pushing overall sales up for the year by nearly 25%. With only about 1,100 burrito joints open know, there is plenty of room to grow.
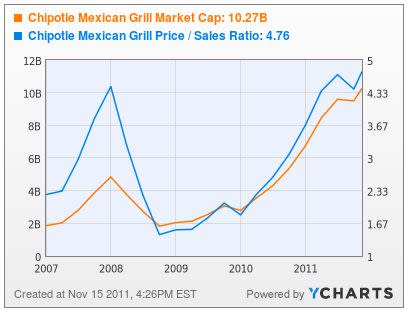
Chipotle Mexican Grill Market Cap Chart by YCharts
Still, a P/E slightly over 50 as of this writing invites scrutiny, invites the shorts and invites current holders' anxiety. Chipotle appears to be a fabulously well-run company. Living up to the stock valuation may require more than that, however.

Jeff Bailey is an editor for the YCharts Pro Investor Service which includes professional stock charts, stock ratings and portfolio strategies.
At the time thisarticle was published The Motley Fool owns shares of Apple, Chipotle Mexican Grill, Whole Foods Market, and lululemon athletica. Motley Fool newsletter services have recommended buying shares of lululemon athletica, Netflix, Chipotle Mexican Grill, Apple, Whole Foods Market, Green Mountain Coffee Roasters, and The Fresh Market. Motley Fool newsletter services have recommended creating a put butterfly position in Chipotle Mexican Grill. Motley Fool newsletter services have recommended creating a lurking gator position in Green Mountain Coffee Roasters. Motley Fool newsletter services have recommended creating a bull call spread position in Apple. Try any of our Foolish newsletter services free for 30 days. We Fools may not all hold the same opinions, but we all believe that considering a diverse range of insights makes us better investors. The Motley Fool has a disclosure policy.
Copyright © 1995 - 2011 The Motley Fool, LLC. All rights reserved. The Motley Fool has a disclosure policy.
