Here's What Is Fueling PepsiCo's Growth

In today's world, most companies span several regions and sell across the world. As Foolish colleague Morgan Housel notes, 10 years ago, less than a third of S&P 500 revenue came from overseas. Today, more than half of the S&P 500's growth comes from overseas.
And that number is growing. The truth is, investors regularly underestimate how much demand comes from abroad. More important, for large, multinational corporations that have already established a presence in their home markets, much of their future growth comes from abroad.
With that in mind, today we're looking at PepsiCo (NYS: PEP) . We'll examine not only where its sales and earnings come from, but how its sales abroad have changed over time.
Where PepsiCo's sales were five years ago
Five years ago, the United States and Canada contributed 66% of Pepsi's growth. That reliance on the Americas is especially notable when you consider Coca-Cola (NYS: KO) was only driving 29% of its sales through the North American market in 2005.
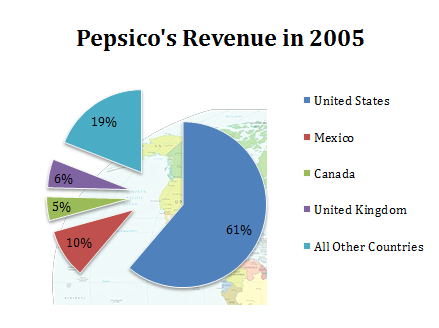
Source: S&P Capital IQ.
Where PepsiCo's sales are today
Today, the United States and Canada still provide the lion's share of PepsiCo's sales, but other markets now contribute 44% of sales. At current growth rates, international markets could be half of PepsiCo's sales within a few years.
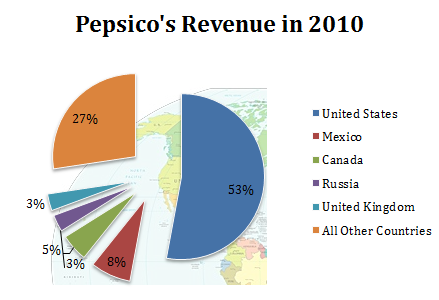
Source: S&P Capital IQ.
The fastest growth is coming from the "All Other Countries" segment, with sales seeing high sustained yield growth rates.
Segment | 5-Year Revenue Growth |
|---|---|
United States | 54% |
Mexico | 46% |
Canada | 104% |
United Kingdom | 4% |
All Other Countries | 155% |
Company-Wide Total | 78% |
Source: S&P Capital IQ. Russia segment excluded; first reported in 2008.
Those revenue growth rates are pretty heady, though they're inflated by acquisitions like PepsiCo's purchase of its bottlers between the 2009 and 2010 fiscal years. PepsiCo has done a fantastic job growing its non-beverage lines, but like other large consumer goods companies facing the realities of size and slowing domestic markets, PepsiCo will increasingly have to look abroad to find growth.
Competitor checkup
One last point to check is how PepsiCo's footprint compares to that of some of its peers:
Company | Geography With Most Sales | Percent of Sales |
|---|---|---|
PepsiCo | United States | 53% |
Coca-Cola | North America | 32% |
Dr Pepper Snapple Group (NYS: DPS) | United States | 89% |
Kraft (NYS: KFT) | United States | 43% |
Source: S&P Capital IQ.
While PepsiCo has been steadily growing its international sales, it has a long way to go before it reaches the same level as Coca-Cola or Kraft. However, Kraft's situations should dramatically change in the near future. The company is planning a spin-off of its lower-growth business and its segments with more emerging-market sales. That'll leave part of its business far more exposed to high-growth markets.
Keep searching
If you're looking to stay updated on PepsiCo, or any other companies listed above, make sure to add them to our watchlist service, My Watchlist. It's free, and it helps you constantly stay updated on news and analysis on your favorite companies.
Add PepsiCo to My Watchlist.
Add Coca-Cola to My Watchlist.
Add Dr Pepper Snapple Group to My Watchlist.
Add Kraft to My Watchlist.
At the time thisarticle was published Eric Bleekerowns shares of no companies listed above. You canfollow him on Twitterto see all of his technology and market commentary.The Motley Fool owns shares of PepsiCo and Coca-Cola.Motley Fool newsletter serviceshave recommended buying shares of PepsiCo and Coca-Cola.Motley Fool newsletter serviceshave recommended creating a diagonal call position in PepsiCo. Try any of our Foolish newsletter servicesfree for 30 days. We Fools may not all hold the same opinions, but we all believe thatconsidering a diverse range of insightsmakes us better investors. The Motley Fool has adisclosure policy.
Copyright © 1995 - 2011 The Motley Fool, LLC. All rights reserved. The Motley Fool has a disclosure policy.
