ION Geophysical Is Cheaper Than You Think

ION Geophysical (NYS: IO) may be cheaper than you think.
In the daily noise machine of CNBC, analyst estimates, and quarterly announcements, investors are inundated with talking heads obsessing over earnings-per-share figures.
Earnings, or net income, is an accounting construction that is the basis for the price-to-earnings ratio, the most popular way of measuring how cheap or expensive a stock is.
But free cash flow - the amount of cash a company earns on its operations minus what it spends on them - is another, oftentimes more accurate measure of earnings that can give you an advantage.
How ION stacks up
If ION tends to generate more free cash flow than net income, there's a good chance earnings-per-share figures understate its profitability and overstate its price tag. Conversely, if ION consistently generates less free cash flow than net income, it may be less profitable and more expensive than it appears.
This graph compares ION's historical net income to free cash flow. (I omitted various gains and charges such as tax deferrals, restructurings, and benefits related to stock options.)
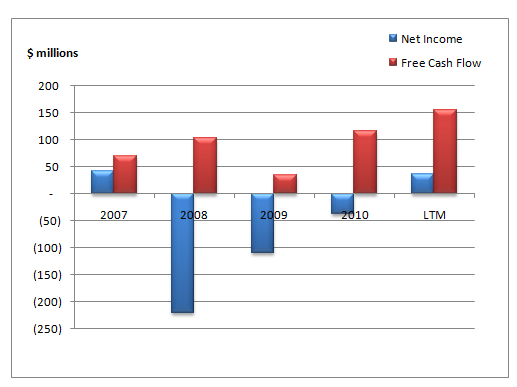
Source: Capital IQ, a division of Standard & Poor's, and author's calculations.
As you can see, ION has a tendency to produce more free cash flow than net income. This means that the standard price-to-earnings multiple investors use to judge companies may overstate its price tag.
There can be a variety of reasons to disregard such a discrepancy; for example, free cash flow can overstate earnings in businesses with volatile working capital needs, or understate earnings in high growth companies that are reinvesting capital in the business.
Alternatively, in cases where free cash flow more accurately measures earnings, such a discrepancy can indicate a company that is more -- or less -- expensive than investors realize.
Let's examine ION alongside some of its peers for additional context:
Company | Price-to-Earnings Ratio | Adjusted Price-to-Free-Cash-Flow Ratio |
|---|---|---|
ION Geophysical | 28.4 | 6.6 |
Dawson Geophysical (NAS: DWSN) | N/A* | N/A* |
TGC Industries (NYS: TGE) | 21.5 | 46.5 |
Global Geophysical (NYS: GGS) | N/A* | 6.7 |
* Negative earnings and free cash flow.
On a net income basis, ION appears to trade about in line with TGC. Neither Dawson nor Global Geophysical produced positive net income over the past 12 months.
But ION also tends to generate much more free cash flow than net income, suggesting that the company's stock might be quite a bit cheaper than many investors realize.
If you'd like to stay up to speed on the top news and analysis on ION or any other stock, simply click here to add it to your stock watchlist. If you don't have one yet, you can create a watchlist of your favorite stocks by clicking here.
At the time thisarticle was published Ilan Moscovitzowns shares of Dawson. The Motley Fool owns shares of ION Geophysical and Dawson Geophysical. Motley Fool newsletter serviceshave recommended buying shares of Dawson Geophysical. Try any of our Foolish newsletter servicesfree for 30 days. We Fools may not all hold the same opinions, but we all believe thatconsidering a diverse range of insightsmakes us better investors. The Motley Fool has adisclosure policy.
Copyright © 1995 - 2011 The Motley Fool, LLC. All rights reserved. The Motley Fool has a disclosure policy.
