Does Boeing Measure Up?

Margins matter. The more Boeing (NYS: BA) keeps of each buck it earns in revenue, the more money it has to invest in growth, fund new strategic plans, or (gasp!) distribute to shareholders. Healthy margins often separate pretenders from the best stocks in the market. That's why we check up on margins at least once a quarter in this series. I'm looking for the absolute numbers, comparisons to sector peers and competitors, and any trend that may tell me how strong Boeing's competitive position could be.
Here's the current margin snapshot for Boeing and some of its sector and industry peers and direct competitors:
Boeing | 19.3% | 7.2% | 5.4% |
General Dynamics (NYS: GD) | 18.2% | 12.1% | 8.2% |
Raytheon (NYS: RTN) | 20.1% | 11.2% | 7.9% |
Lockheed Martin (NYS: LMT) | 10.5% | 8.4% | 6.1% |
Source: Capital IQ, a division of Standard & Poor's. TTM = trailing 12 months.
Unfortunately, that table doesn't tell us much about where Boeing has been, or where it's going. A company with rising gross and operating margins often fuels its growth by increasing demand for its products. If it sells more units while keeping costs in check, its profitability increases. Conversely, a company with gross margins that inch downward over time is often losing out to competition, and possibly engaging in a race to the bottom on prices. If it can't make up for this problem by cutting costs -- and most companies can't -- then both the business and its shares face a decidedly bleak outlook.
Of course, over the short term, the kind of economic shocks we recently experienced can drastically affect a company's profitability. That's why I like to look at five fiscal years' worth of margins, along with the results for the trailing 12 months (TTM), the last fiscal year, and last fiscal quarter (LFQ). You can't always reach a hard conclusion about your company's health, but you can better understand what to expect, and what to watch.
Here's the margin picture for Boeing over the past few years:
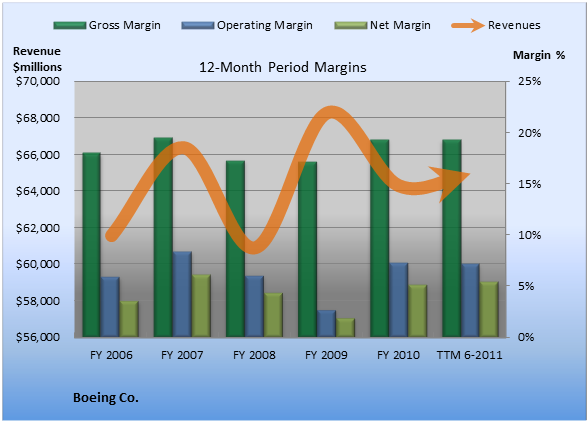
Source: Capital IQ, a division of Standard & Poor's. Dollar amounts in millions. FY= fiscal year. TTM = trailing 12 months.
Because of seasonality in some businesses, the numbers for the last period on the right -- the TTM figures -- aren't always comparable to the FY results preceding them. To compare quarterly margins to their prior-year levels, consult this chart:
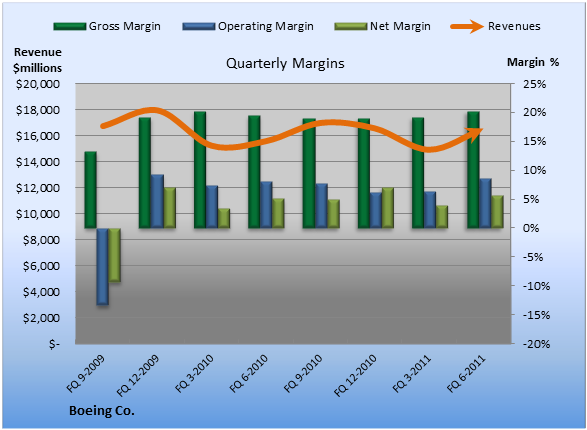
Source: Capital IQ, a division of Standard & Poor's. Dollar amounts in millions. FQ = fiscal quarter.
Here's how the stats break down:
With recent TTM operating margins exceeding historical averages, Boeing looks like it is doing fine.
If you take the time to read past the headlines and crack a filing now and then, you're probably ahead of 95% of the market's individual investors. To stay ahead, learn more about how I use analysis like this to help me uncover the best returns in the stock market. Got an opinion on the margins at Boeing? Let us know in the comments below.
At the time thisarticle was published Seth Jaysonhad no position in any company mentioned here at the time of publication. You can view his stock holdingshere. He is co-advisor ofMotley Fool Hidden Gems, which provides new small-cap ideas every month, backed by a real-money portfolio. The Motley Fool owns shares of General Dynamics, Raytheon, and Lockheed Martin. Try any of our Foolish newsletter servicesfree for 30 days. We Fools may not all hold the same opinions, but we all believe thatconsidering a diverse range of insightsmakes us better investors. The Motley Fool has adisclosure policy.
Copyright © 1995 - 2011 The Motley Fool, LLC. All rights reserved. The Motley Fool has a disclosure policy.
