The 20 cities where Americans work the least

America is notorious for its work ethic, where overwork and stress become badges of honor.
According to the Organization for Economic Co-operation and Development, Americans logged on average 1,789 hours of work in 2014. That's at least 100 more hours a year than in European countries like the UK, France, Germany, or Denmark.
And when looking at US census data, that number could be higher, since the average working American logs about 39 hours a week.
But working longer hours and having less downtime can take its toll on our health and productivity.
Personal-finance site WalletHub recently analyzed and ranked 116 of the most populated cities based on six metrics related directly or indirectly to work. To read more about the study's methodology, check out the full report here.
Americans living in the following cities generally put in less hours than the average American, spend less time commuting, and have more time to themselves:
No. 20: Bridgeport, Connecticut

City of Bridgeport, CT - Government/Facebook
Average hours worked per week: 36.4
Labor-force participation rate: 75.95%
Minutes spent commuting on an average day: 27
Percentage of workers with multiple jobs: 5.90%
Minutes of leisure time spent on an average day: 343.19
No. 19: Madison, Wisconsin

Average hours worked per week: 35.9
Labor-force participation rate: 79.42%
Minutes spent commuting on an average day: 19.4
Percentage of workers with multiple jobs: 6.70%
Minutes of leisure time spent on an average day: 336.73
No. 18: Santa Ana, California

Average hours worked per week: 36.9
Labor-force participation rate: 72.96%
Minutes spent commuting on an average day: 24.7
Percentage of workers with multiple jobs: 4.10%
Minutes of leisure time spent on an average day: 319.65
No. 17: Pittsburgh, Pennsylvania

Average hours worked per week: 37
Labor-force participation rate: 70.60%
Minutes spent commuting on an average day: 23.2
Percentage of workers with multiple jobs: 5.60%
Minutes of leisure time spent on an average day: 351.2
No. 16: Milwaukee, Wisconsin

Shutterstock
Average hours worked per week: 36.6
Labor-force participation rate: 72.05%
Minutes spent commuting on an average day: 22.16
Percentage of workers with multiple jobs: 70%
Minutes of leisure time spent on an average day: 336.73
No. 15: Baton Rouge, Louisiana

Shutterstock.com
Average hours worked per week: 36.8
Labor-force participation rate: 72.12%
Minutes spent commuting on an average day: 21
Percentage of workers with multiple jobs: 4.30%
Minutes of leisure time spent on an average day: 334.37
No. 14: Cincinnati, Ohio

Average hours worked per week: 36.9
Labor-force participation rate: 72.28%
Minutes spent commuting on an average day: 22.4
Percentage of workers with multiple jobs: 6.20%
Minutes of leisure time spent on an average day: 368.10
No. 13: Stockton, California

Average hours worked per week: 37
Labor-force participation rate: 68.07%
Minutes spent commuting on an average day: 26.8
Percentage of workers with multiple jobs: 4.10%
Minutes of leisure time spent on an average day: 319.65
No. 12: Riverside, California

Shutterstock
Average hours worked per week: 36.8
Labor-force participation rate: 69.29%
Minutes spent commuting on an average day: 29.2
Percentage of workers with multiple jobs: 4.10%
Minutes of leisure time spent on an average day: 319.65
No. 11: Hialeah, Florida
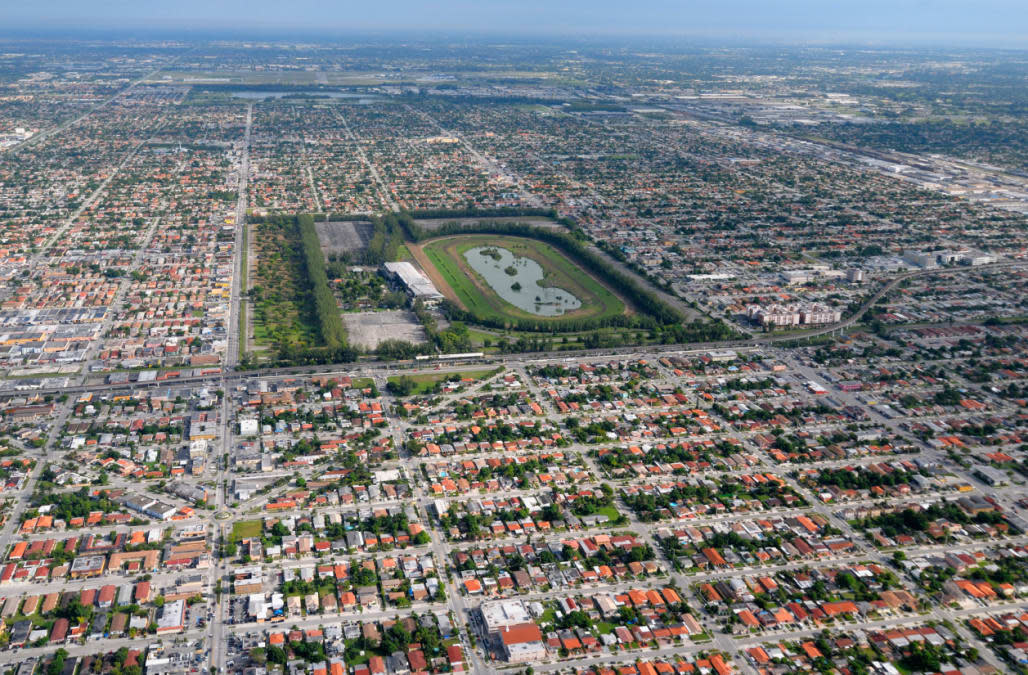
Average hours worked per week: 37
Labor-force participation rate: 72.18%
Minutes spent commuting on an average day: 24
Percentage of workers with multiple jobs: 3.30%
Minutes of leisure time spent on an average day: 343.46
No. 10: Fresno, California
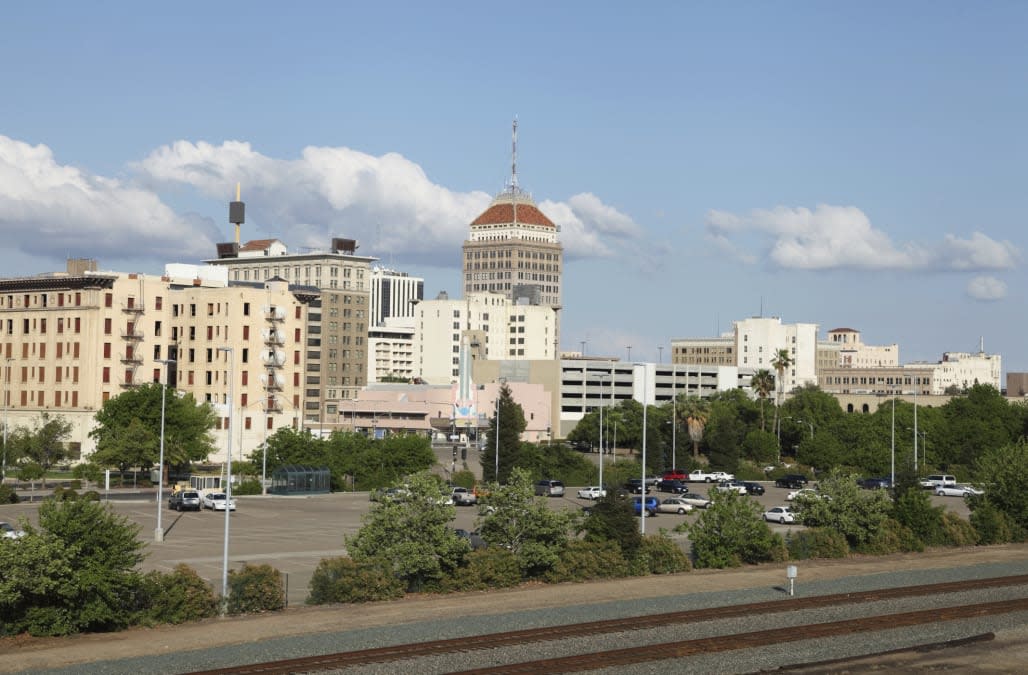
Average hours worked per week: 36.8
Labor-force participation rate: 68.76%
Minutes spent commuting on an average day: 21.5
Percentage of workers with multiple jobs: 4.10%
Minutes of leisure time spent on an average day: 319.65
No. 9: Cleveland, Ohio

Shutterstock
Average hours worked per week: 36.7
Labor-force participation rate: 67.70%
Minutes spent commuting on an average day: 24.2
Percentage of workers with multiple jobs: 6.20%
Minutes of leisure time spent on an average day: 368.10
No. 8: Toledo, Ohio

Shutterstock
Average hours worked per week: 36.4
Labor-force participation rate: 71.84%
Minutes spent commuting on an average day: 19.2
Percentage of workers with multiple jobs: 6.20%
Minutes of leisure time spent on an average day: 368.10
No. 7: Tucson, Arizona

Shutterstock
Average hours worked per week: 36.4
Labor-force participation rate: 70.28%
Minutes spent commuting on an average day: 22.1
Percentage of workers with multiple jobs: 4.20%
Minutes of leisure time spent on an average day: 325.70
No. 6: Columbia, South Carolina

Average hours worked per week: 37.3
Labor-force participation rate: 66.52%
Minutes spent commuting on an average day: 16.1
Percentage of workers with multiple jobs: 3.70%
Minutes of leisure time spent on an average day: 376.98
No. 5: Buffalo, New York

AP
Average hours worked per week: 36.3
Labor-force participation rate: 67.45%
Minutes spent commuting on an average day: 20.4
Percentage of workers with multiple jobs: 4%
Minutes of leisure time spent on an average day: 349.43
No. 4: San Bernardino, California

Average hours worked per week: 36.4
Labor-force participation rate: 62.35%
Minutes spent commuting on an average day: 27.1
Percentage of workers with multiple jobs: 4.10%
Minutes of leisure time spent on an average day: 319.65
No. 3: Providence, Rhode Island

Average hours worked per week: 35.6
Labor-force participation rate: 70.12%
Minutes spent commuting on an average day: 21.8
Percentage of workers with multiple jobs: 6.40%
Minutes of leisure time spent on an average day: 423.3
No. 2: Detroit, Michigan

Average hours worked per week: 36
Labor-force participation rate: 61.36%
Minutes spent commuting on an average day: 26.8
Percentage of workers with multiple jobs: 4.50%
Minutes of leisure time spent on an average day: 341.84
No. 1: Burlington, Vermont

Shutterstock
Average hours worked per week: 33.1
Labor-force participation rate: 70.67%
Minutes spent commuting on an average day: 17.6
Percentage of workers with multiple jobs: 8.50%
Minutes of leisure time spent on an average day: 305.18
See Also:
SEE ALSO: The 20 cities where Americans work the hardest
DON'T MISS: The 13 best jobs for people who don't want to work a lot
